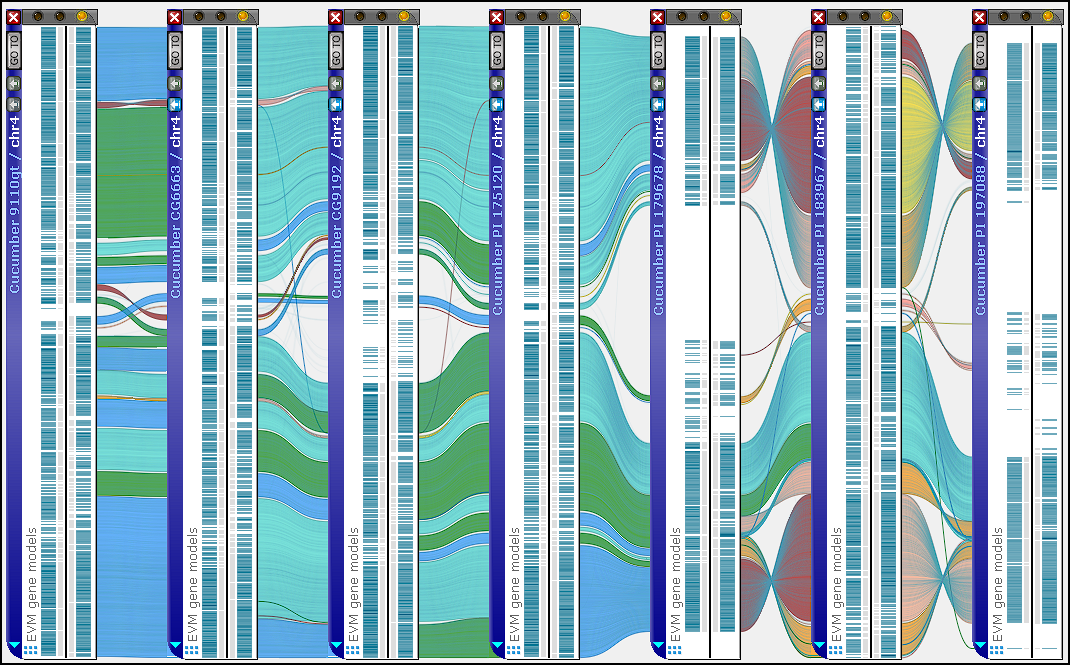
Synteny Matrix with Parallel Layout
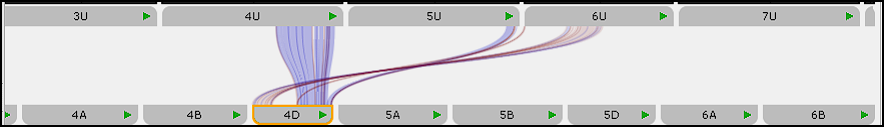
If you haven’t noticed, we’ve added a new view of the synteny matrix that arranges all maps from both genomes in two parallel rows. In many cases, this layout highlights structural variations—such as inter‑chromosomal translocations—more clearly than the traditional matrix.
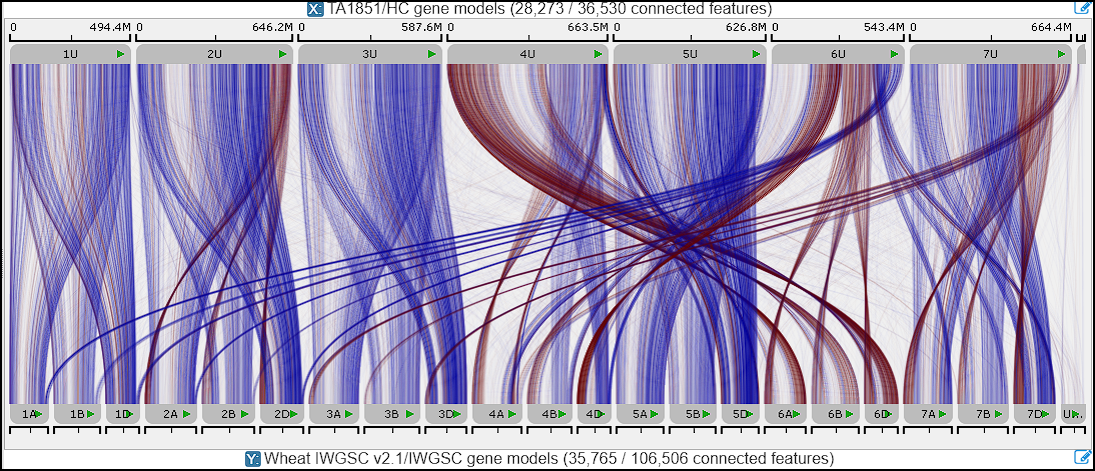
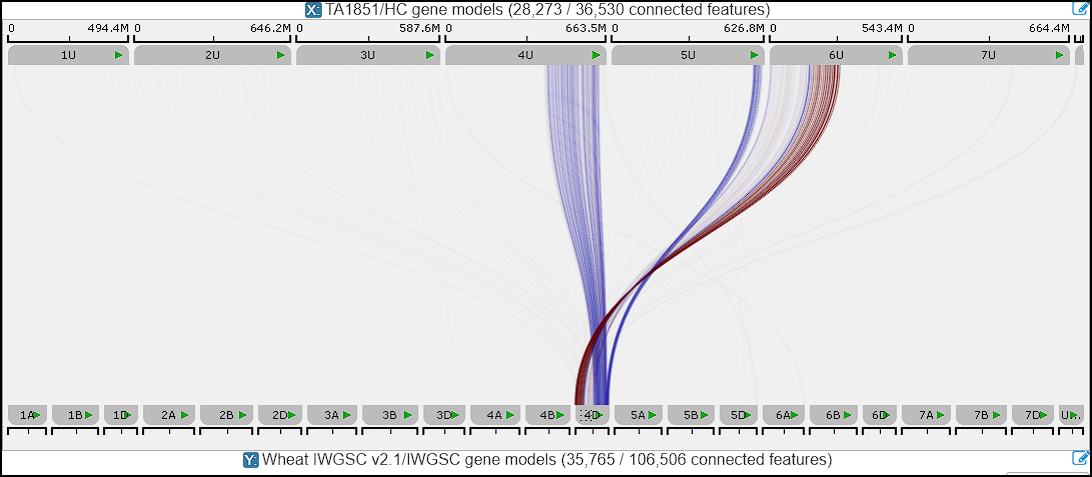
When comparing two complete map sets, the number of connector lines between markers or orthologs can be very large, making the visualization difficult to interpret. There are several ways to reduce this visual clutter. For example, hovering the mouse over any map temporarily hides all unrelated links, allowing you to focus on connections for that map alone. Clicking a map locks this filtered state, showing only the connectors relevant to the selected map.
Another way to simplify the synteny view is to enable line clustering, which replaces groups of consistent connectors with ribbon‑style links. To support this, we introduced a dedicated interface for adjusting connector settings. It opens in a separate form that can remain floating or be docked, depending on your workflow.
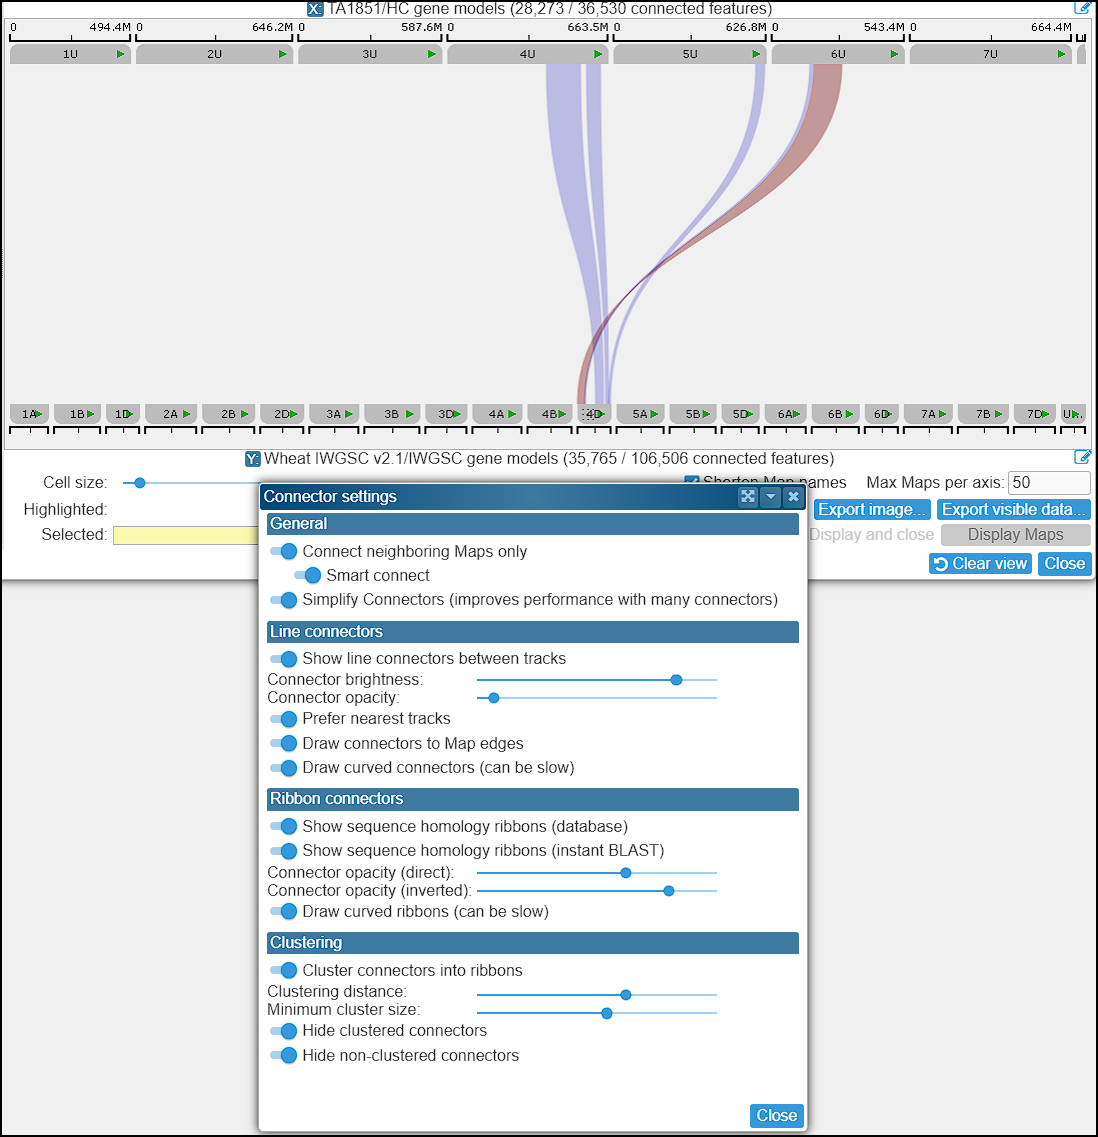
Within this panel, you can control the visibility of individual line connectors, adjust the opacity of ribbon connectors (separately for direct and reverse orientations), and fine‑tune the clustering parameters. For a more schematic representation, you can hide unclustered connectors entirely and display only the computed synteny ribbons.
Please note that this settings panel also affects connector rendering in the main stage.