Tip: Using Export to create new tracks
When exporting the track data, a user is presented with a data grid that can be customized. We can use this to create an output file in CSV format that can be imported back to create a new track.
For example, if we want to mark the location of genes with specific qualities, such as having some keyword in their description, we can place the corresponding labels in the form of a neighboring marker track. Remember that in Persephone terms, a marker mapping is a named position on a map. The position can be a single point or an interval. So, our markers will mark the regions corresponding to the genes of interest. The features in the marker track are shown with labels, so, we will see the gene names shown in the track.
To create a CSV file, we will need to export four columns: map name, feature name, start, and end. Before exporting the data, we will find only features that satisfy the criteria and export the filtered set only.
Let’s say, we are interested in marking all HLA (human leukocyte antigen) genes on chromosome 6 of the human genome.
We will start by exporting a gene model track:
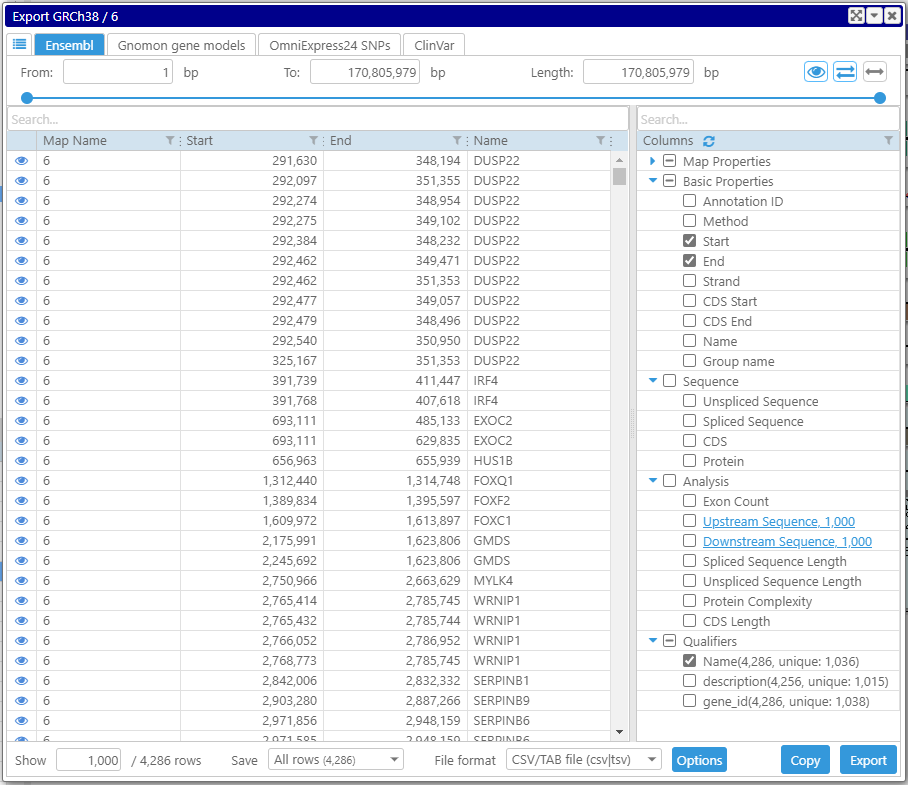
We leave the four columns: map name, map’s start and end, and Name qualifier. By moving the last column with the gene name between columns 1 and 3, we make sure that the output matches the CSV format for importing markers.
As long as we will be analyzing the data by filtering the rows of the grid, we need to include all of the genes on the chromosome in the grid. By default, the view shows just the first 1,000 rows. If we put 10,000 instead of 1,000, the number of displayed rows will be adjusted to the maximum possible one – the total number of rows (4,286).
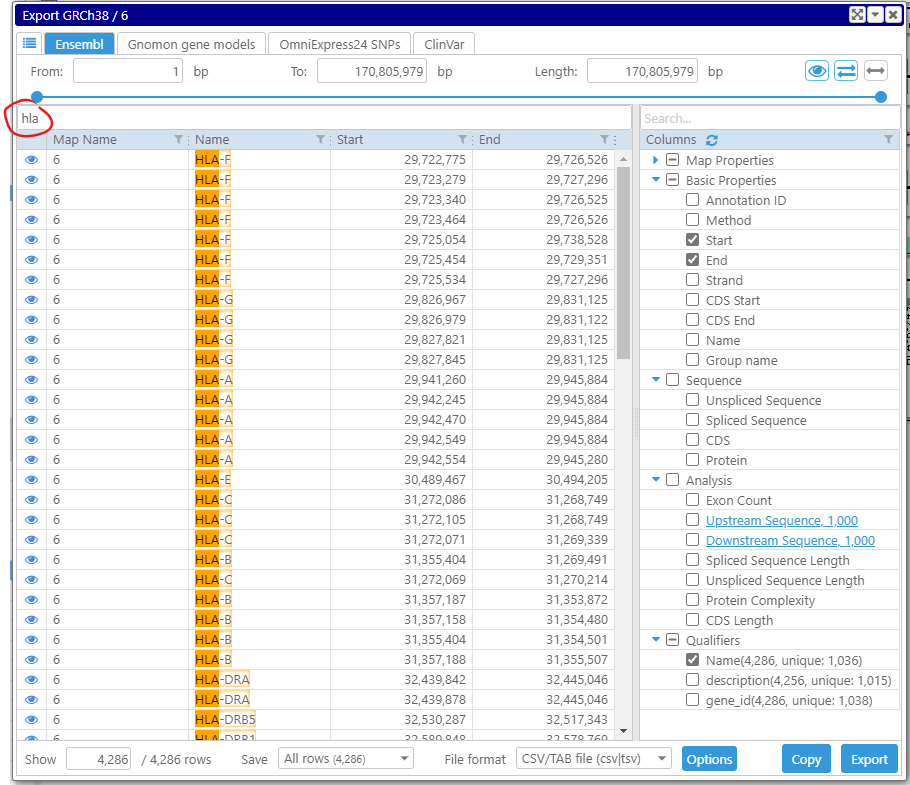
Now, we start typing “hla” in the search box on top of the form. Note, for more complex queries, we can use filters on individual columns that allow advanced filtering of the values. The grid now contains only rows that have “hla” in one of their columns.
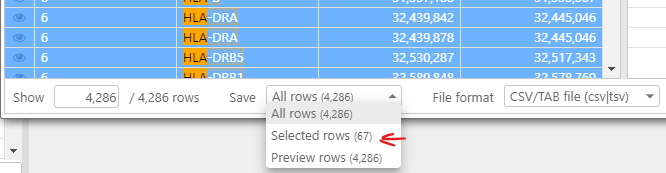
To export these rows only, select all visible rows with Ctrl-A and export “Selected rows”:
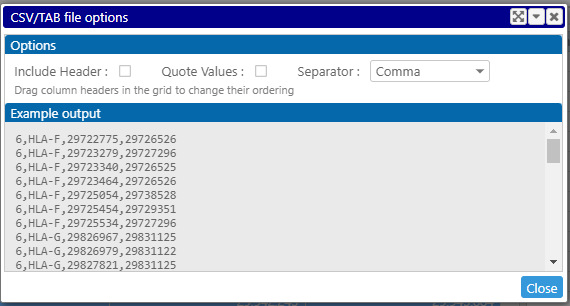
Control the output format by using the Options dialog. Make sure to remove the column headers:
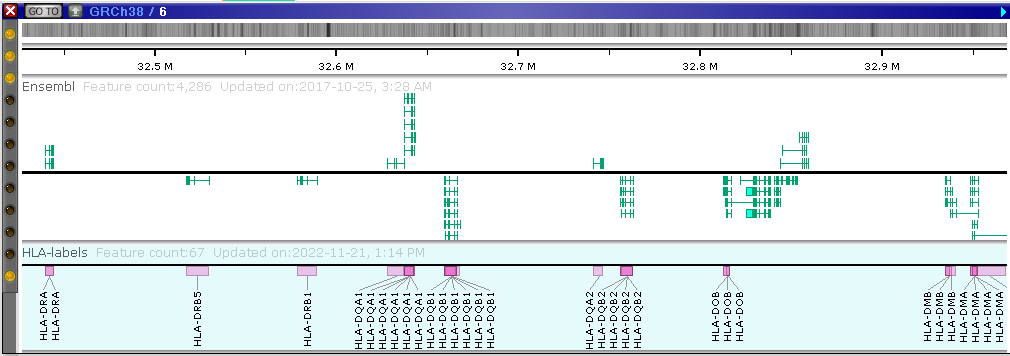
The import of the CSV file with the “markers” is straightforward – just drag&drop the newly exported file and follow the import instructions. The HLA gene name labels will appear alongside the gene models:
Note, the redundant rows with identical values will be collapsed. The duplicate rows will be automatically hidden.
A similar trick can be used to mark genes satisfying many other criteria, such as the genes with suspicious translation, or short CDS, or some qualifier that needs attention, etc.