The Summer Update: Motif Search and Analysis of Variants
We keep adding new features to Persephone. In the Summer Update, we introduced DNA motif search and the tools for analysis of variation in a given genomic region.
DNA motif search
This feature has been designed to help answer challenging questions in real time, such as showing the distribution of motifs along entire chromosomes. Imagine a track that shows the location of all occurrences of a dinucleotide CG in a chromosome of 500 Mbp in size. This is quite a task considering there could be tens of millions of hits that should be shown simultaneously on one screen.
The motif can contain IUPAC codes, such as ‘w’ or ‘k’. The search window is combined with the sequence view where navigation is linked with the map’s graphical view. The text selection or cursor movement is automatically reflected in the graphics. This provides a comprehensive view of the found motifs and their genomic context.
It is sometimes interesting to see that the distribution of some motifs along the chromosome is not uniform. For example, searching for the locations of the centromere Protein-B binding satellite DNA motif ‘YTTCGTTGGAARCGGGA‘ will help locate the centromere in the mammalian chromosomes.
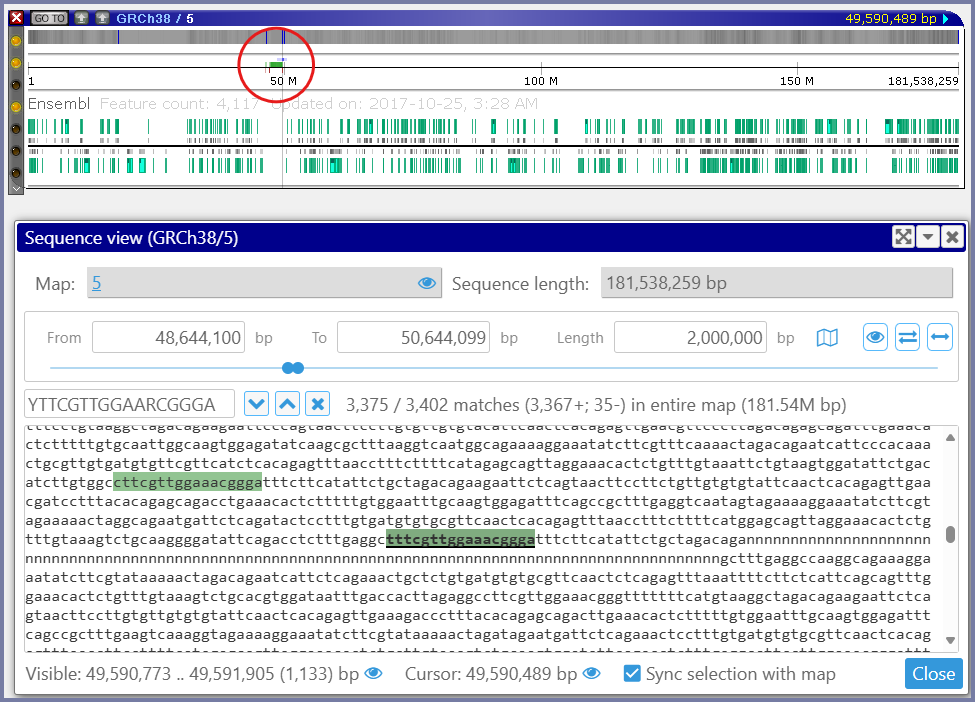
The top panel shows the graphical representation of the chromosome 5 of Homo sapiens with a track of found motifs (binding of CENP-B). The bottom panel gives the detailed view of the sequence.
Analysis of variants
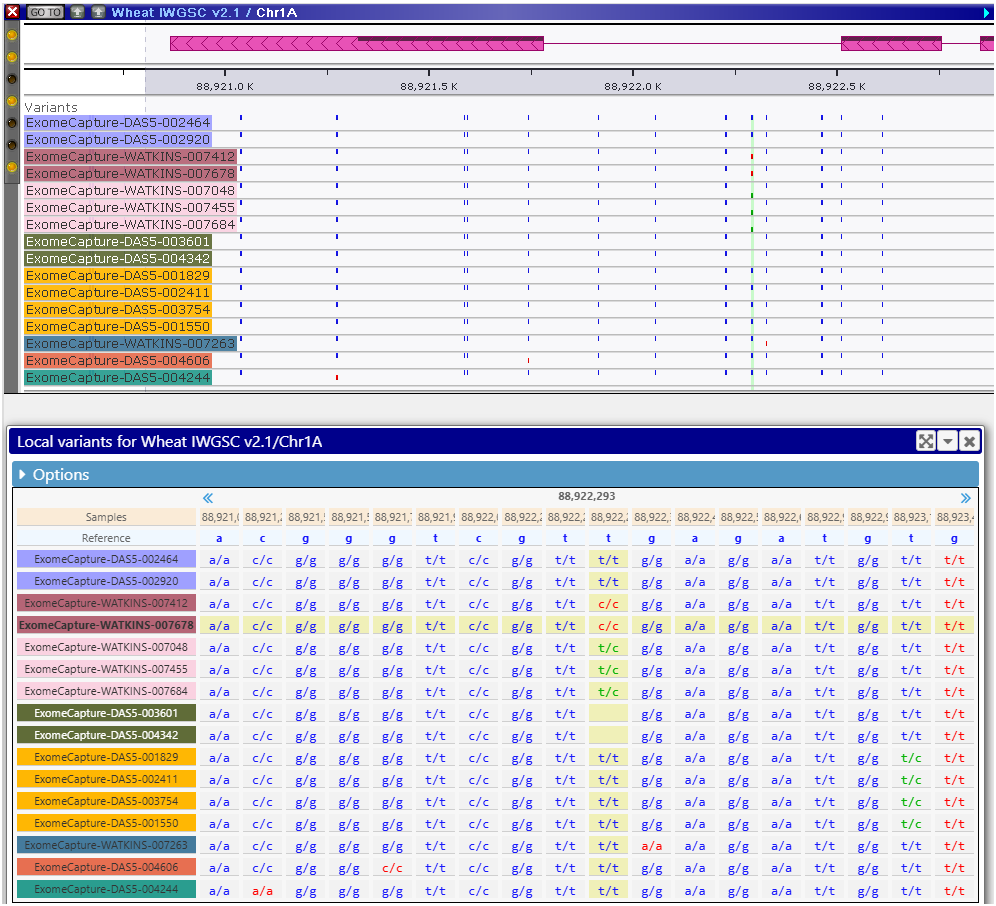
We have redesigned the interface to select the genotyping samples loaded from VCF files. In the original approach, to see and study the variants, the user needs to select the samples first. This can be done based on the metadata of the samples, such as the country of origin, or a phenotypic measurement, or on the similarity to the reference genome. We have added another way of choosing the right samples – by using the “analysis” columns. First, highlight a region of a genome (typically a gene, but not more than 2 Mbp). Now, you have an option of adding a column to the grid of available samples and use its values to sort or group the samples. For example, you can request to collect all distinct variants in the region and group the samples with identical sets of SNPs/indels. If you now select a sample from each group, you will have the most diverse set of genotypes for the selected gene or region. Each group can be assigned a different color, to make it easier to see when the SNPs belong to the same group.
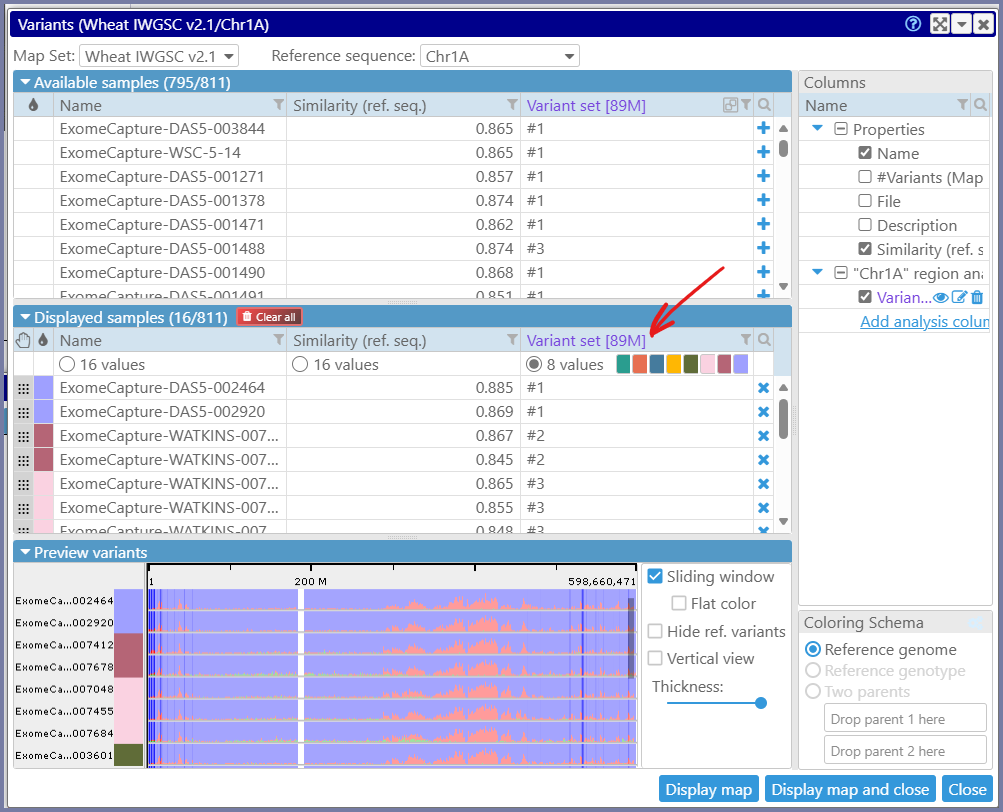
You can now ask questions like “Which of the 3000 varieties has the version of the gene most different from the reference”. This is done by adding the analysis column based on the similarity to the reference in the highlighted genome segment. You can even limit the analysis to SNPs/indels that alter gene translation or to the variants that fall into promoter regions.