The Spring Update: virtual tracks and statistics pages
We are excited to announce the new version of Persephone which brings major feature updates.
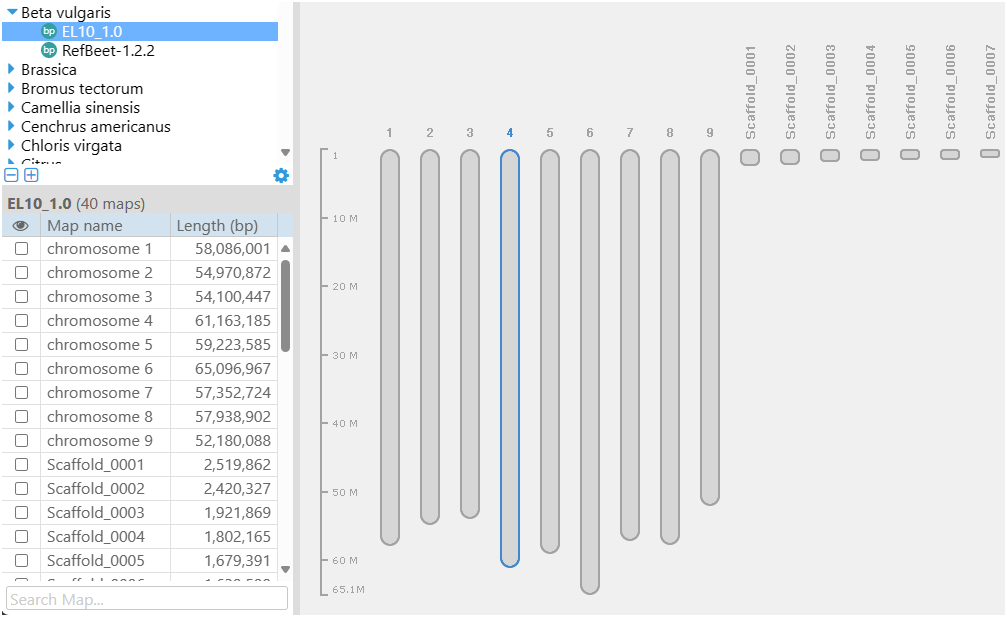
A bird’s-eye view of the genome is shown when a map set is selected. If the application’s main background space is empty, it will show a graphical representation of the selected genome. The chromosome entries are displayed first, the other maps fill the rest of the available space. This design enables users to swiftly gain an overview of the assembly, with maps scaled to their respective sizes. The chart is interactive, allowing for the opening of maps in the main view.
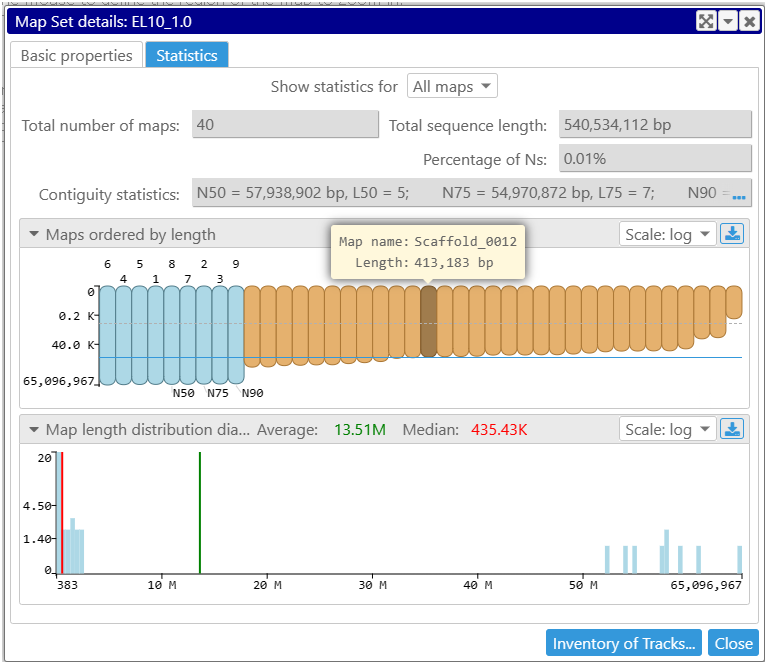
The full statistical overview of a genome is available as a new tab in the Map set properties form. The main contiguity statistic values such as N50 or L50 are calculated for the full assembly or for a subset of sequences, which can be limited to chromosomes or scaffolds only.
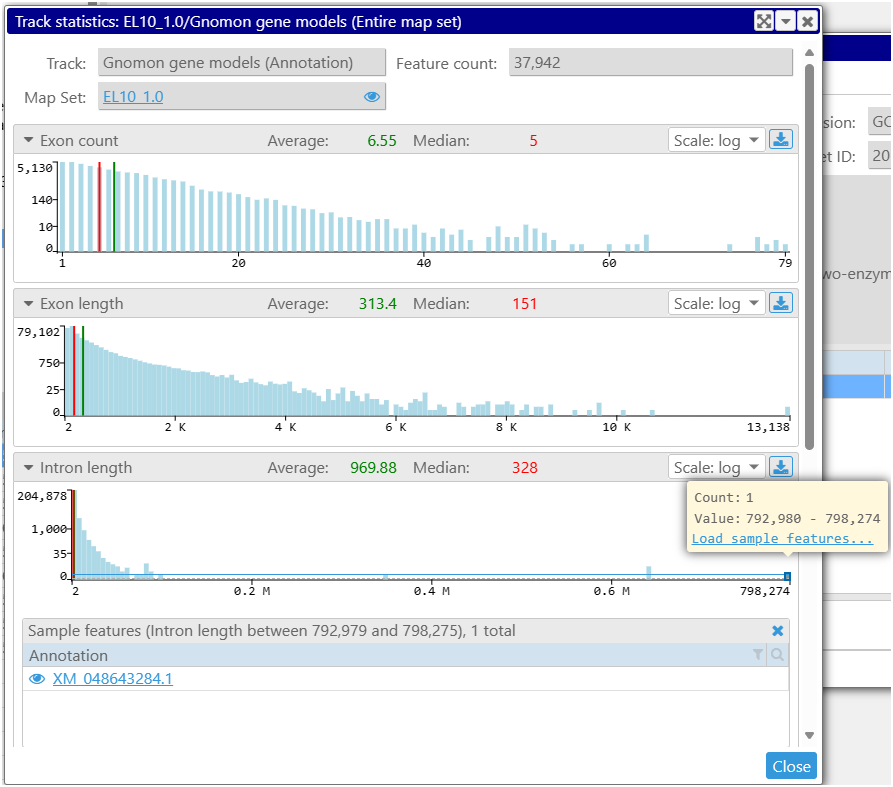
We also added statistics for annotation tracks with gene models. It is now easy to estimate the stats for the size distribution of the features calculated for one map or analyze the entire map set. One of the important measurements is the histogram of intron sizes for the given organism. Knowing it will help provide the correct limit on the maximum intron size when running an NGS alignment. The histogram is interactive, which allows to list the sample genes in a selected range. Sometimes, the outliers with extreme values reveal problems with predicted models.
For more examples, please visit Web Persephone: Statistics (persephonesoft.com).
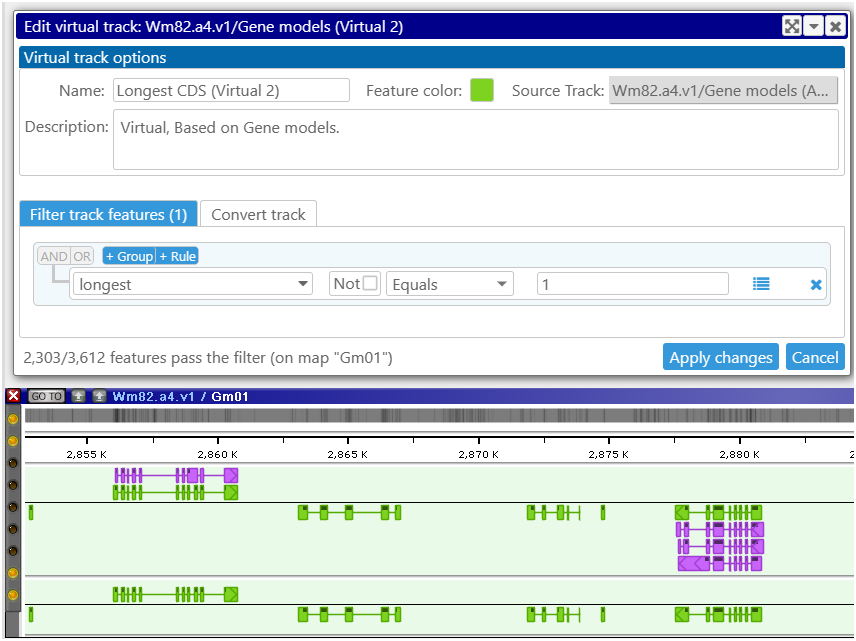
A powerful addition to the functionality of the application is provided by Virtual tracks. The users now have the ability to create new tracks by filtering and converting the existing tracks. Currently, this feature is implemented for the annotation or marker tracks. This allows, for example, creating a track with gene models that have a specific qualifier, such as ‘longest CDS’. This way, you will have a track where gene clusters are represented by the splice variant with the longest CDS. Multiple parameters can be used for filtering the features. They are common with the properties used in the Export interface.
You can now give specific colors to genes with different qualities. It could be quite useful to paint the genes that have problems with their protein product in a different color. The criteria for selecting such suspicious genes could be based on premature stop codons or missing ‘M’ at the start of the protein sequence.
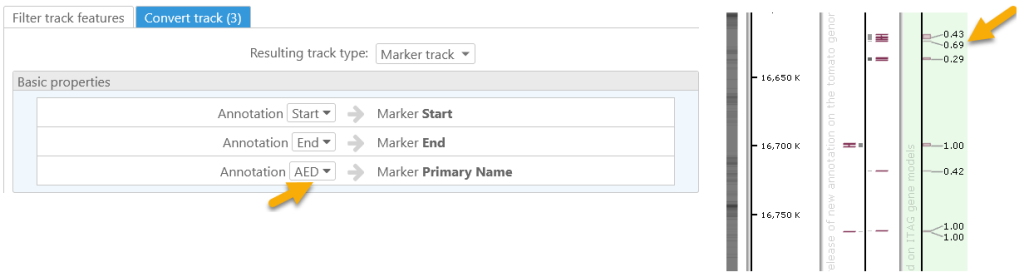
If you want to display a value of some qualifier for a gene, use the Track conversion function. Create a marker track where the coordinates of each feature are inherited from the gene models and the label text is customized by assigning it to a qualifier, such as AED score.
If it is important to see the orientation of the marker mapping, convert the marker track to an annotation track. This trick will display the features in two strands.
Creating the virtual tracks is very flexible and allows using complex rules. Try, for example, to show only markers in ClinVar track on human genome that are linked to ‘cancer’ and the mutations are ‘Pathogenic’ or ‘Likely pathogenic’. See more examples at Web Persephone: Virtual Tracks (persephonesoft.com).
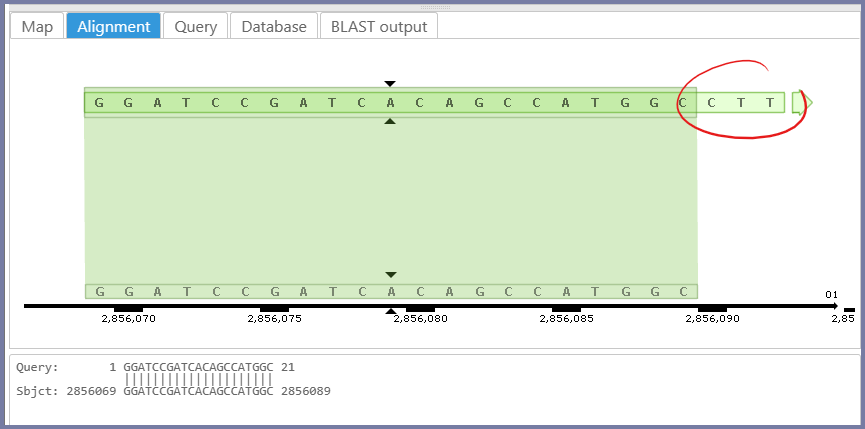
We changed the BLAST interface. The result for the primer search will show the unmatched query nucleotides not included in the BLASTN report:
When entering the BLAST queries, Persephone shows the count and size of the queries.
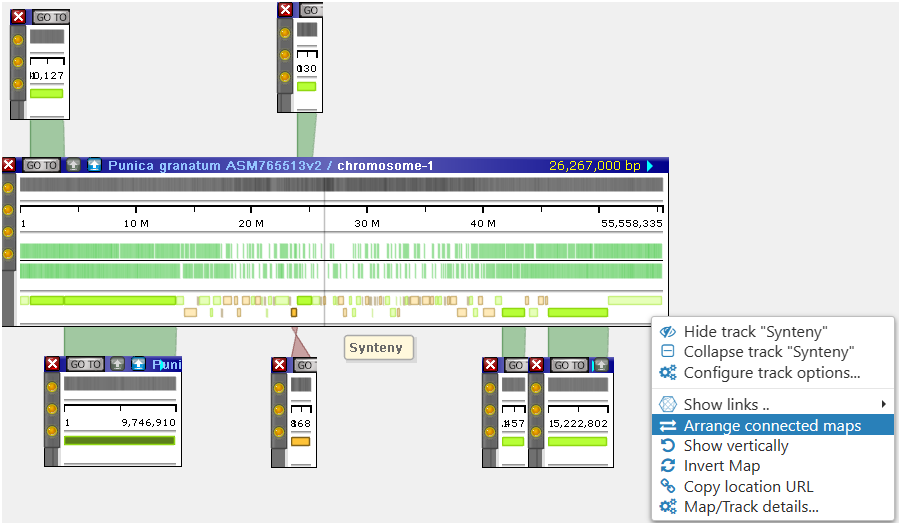
A new menu item Arrange connected maps will correctly align multiple scaffolds to the main reference based on connected synteny ribbons:
There are many other improvements in the Spring Update. Please check them out by visiting our website at https://web.persephonesoft.com