Solanum Pangenome Loaded
We have loaded 23 genomes of the genus Solanum from the project described at Solgenomics.net. The set includes species such as bitter tomato, African eggplant, melon-pear, and others. They can be opened in Persephone by following these direct links:
Solanum abutiloides v1.1
Solanum aethiopicum 1371 v1.0
Solanum aethiopicum v1.5
Solanum aethiopicum 2060 v1.0.3
Solanum americanum v1.1
Solanum anguivi v1.1
Solanum candidum v1.1
Solanum citrullifolium v1.1
Solanum cleistogamum v1.2
Solanum giganteum v1.2
Solanum havanense v1.2
Solanum insanum v1.1
Solanum linearifolium v1.2
Solanum macrocarpon v1.5
Solanum mammosum v1.1
Solanum muricatum v1.3
Solanum prinophyllum v1.3
Solanum pseudolulo v1.1
Solanum quitoense v1.3
Solanum robustum v1.2
Solanum stramoniifolium v1.1
Solanum torvum v1.1
Solanum violaceum v1.1
Solanum etuberosum v1.2
Additionally, we have expanded the Solanum pangenome by linking other Solanum species, such as the standard popular Solanum lycopersicum (tomato) and Solanum tuberosum (potato) assemblies.
Solanum lycopersicum FLA 1.3
Solanum lycopersicum M821.3
Solanum lycopersicum SL4.0
Solanum lycopersicum ITAG5.0
Solanum lycopersicum SLT1.0
Solanum tuberosum DM 1-3 516 R44
Solanum tuberosum DM_v4.03
Each map set has a gene annotation track. The orthologous gene pairs are used to align the individual maps, which allows the stacking of multiple maps together in interactive graphics like this:
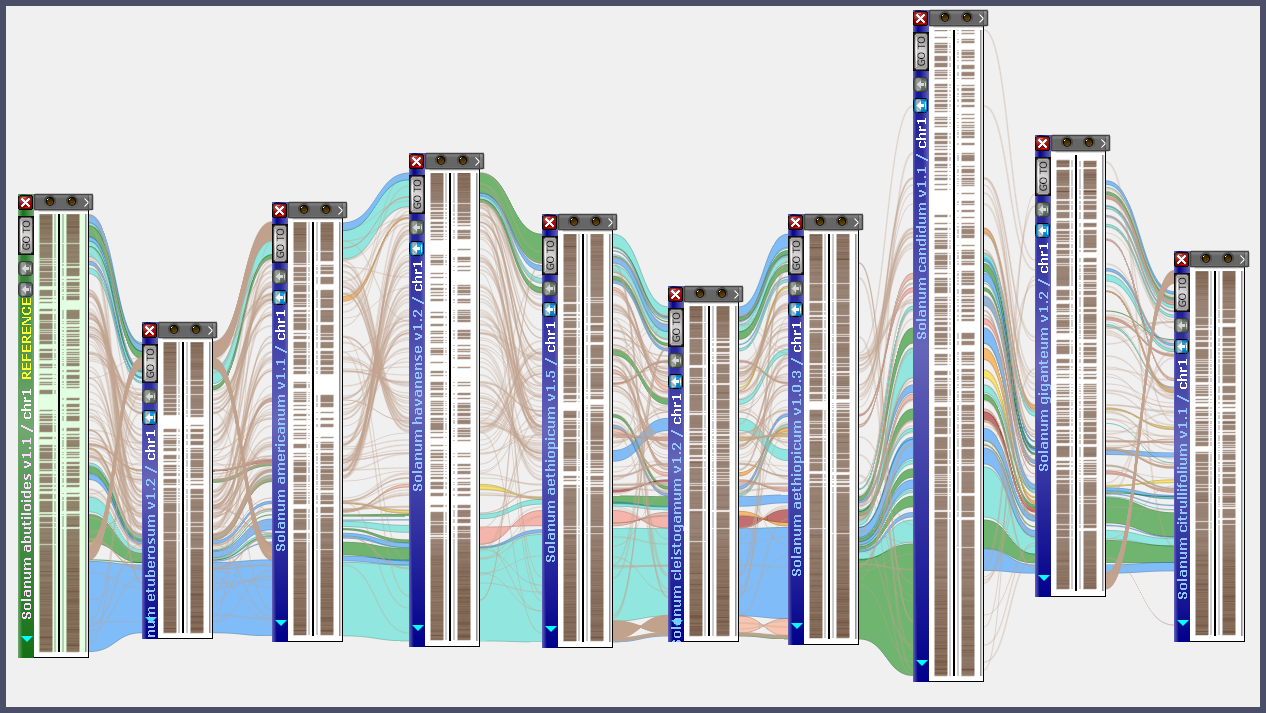
Various methods can be utilized to explore the pangenome effectively. For example, when working with a map on the screen, you can locate a syntenic map by selecting the context menu item “Find synteny…”. This action opens the Multimap module and sets the clicked map as the reference. Subsequently, the list of genomes available for linking to this map is filtered, and maps within each genome are sorted, prioritizing the best match at the top. To conduct a pairwise whole genome comparison, call the Synteny Matrix. Once a genome is selected in the top panel, the tree of available map sets in the bottom panel dynamically filters to display only the genomes linked to the query genome.
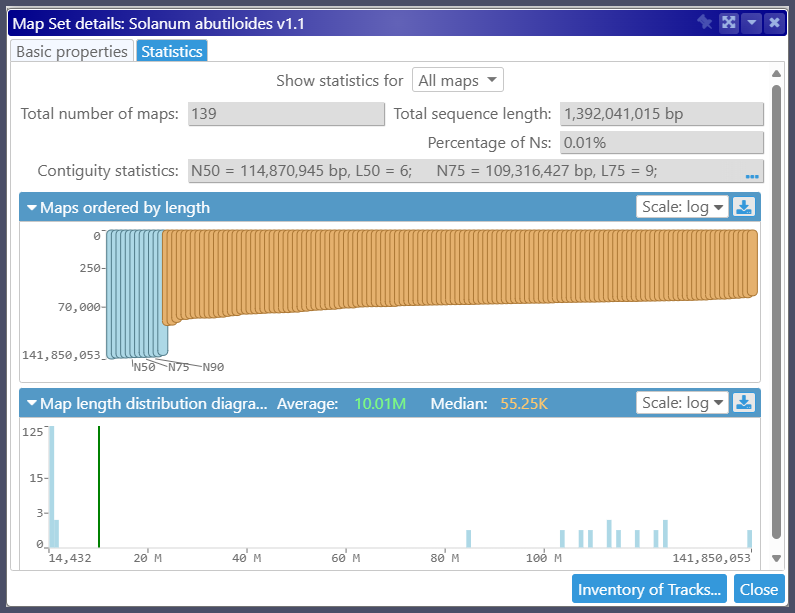
As usual, the properties of each assembly, such as the contiguity statistic, N50, or percentage of Ns, are available via context menu:
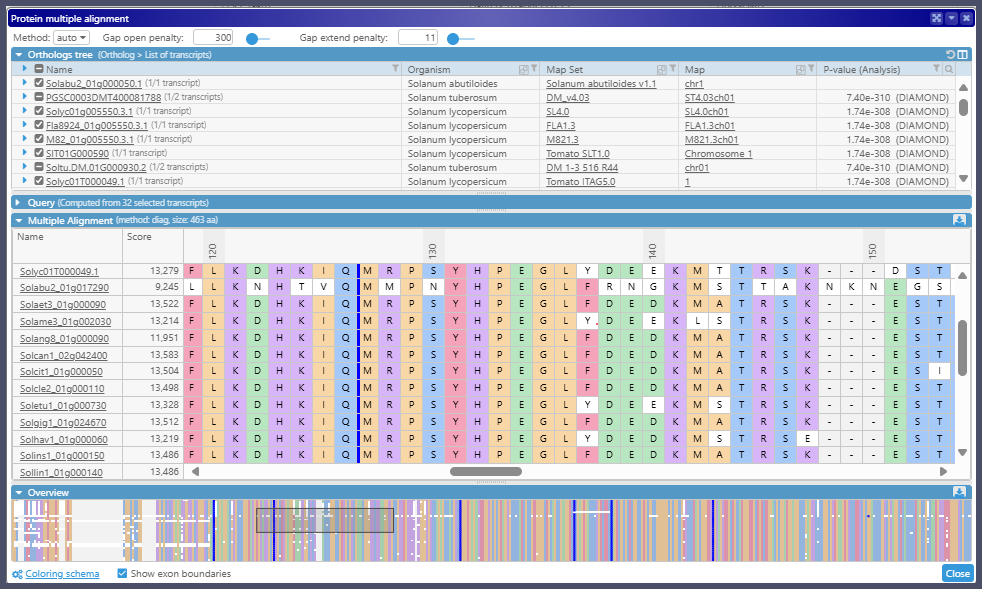
The protein sequences from the ortholog groups can be studied via the protein multiple alignment interface:
We will be happy to hear your feedback.