New features: highlights, export search results, and other improvements
The web version of Persephone has now a few new features.
Highlights
Drag the mouse while holding Ctrl key to highlight a region on a map. The highlight is temporary, another selection will remove the previous highlight unless it is made permanent. When saving the highlight, you can give it a name (label), a distinct color, and a description. The boundaries of highlights will snap on the features of the track where the mouse is positioned. To adjust the highlight coordinates, hold the Ctrl key and drag the edges of the selected region. Using the highlight can help you measure the distance between features. Also, the named highlights will enable users to manually annotate the maps by adding personal comments to the regions of interest.

Export search results
When searching for keywords in annotations, markers, or maps, you can export the results using Persephone’s standard export interface. For example, if you search for the word ‘sugar’ in the gene properties, the search results may include genes from multiple organisms. The set of properties listed in the grid with the search results is limited. Call the Export results and define additional properties to save. For example, this interface will allow you to cut out promoters for the genes somehow related to sugar and export the sequences in FASTA format.
BLAST interface rearranged
To our surprise, not all users were aware of the possibility to select multiple genomes as BLAST subjects. To make it obvious, we introduced checkboxes for each genome (and their maps). In case when there are dozens of genomes to BLAST against, a quick search feature will become quite handy. Start typing a text from the map set name you are searching for to narrow down the list of shown items. A summary panel at the bottom will display all genomes armed for BLAST and their total size.

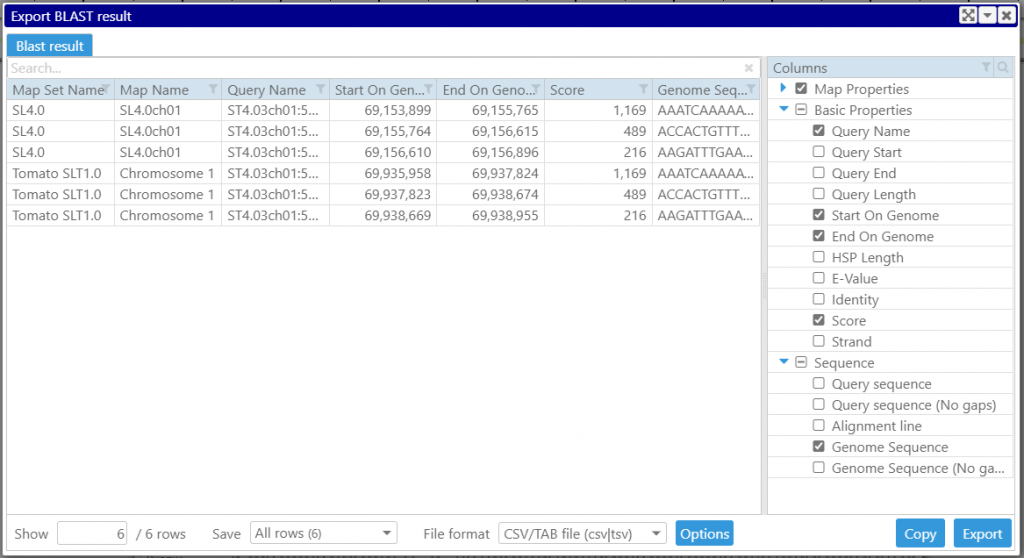
Once the BLAST search is done, you can export the results. This includes the HSP coordinates and sequences with or without gaps.

Export genome region under a marker
The marker track export, among other properties, includes now the genomic sequence corresponding to a marker’s mapping position. It is quite common to store marker’s probe sequences used for mapping into the database. Persephone will show all associated sequences in the marker’s properties form. In case such sequences are missing, an approximation of the mapping probe sequence can be extracted from the genomic region “covered” by the marker.
Filtering, searching, and sorting the grids
Many grids across the application have been redesigned to include filtering, sorting, and searching. Clicking a small magnifying glass in the corner will open the quick-search field above the grid. The filters for each grid column are quite powerful. They will allow you to apply different filters depending on the type of the data in the column. When selecting the filter of type “Values”, you will see all distinct values listed in the column and their counts providing a quick analysis of the contents of the grid.

CRAM and CSI index files are now supported
In addition to popular BAM files, we can now visualize CRAM files. Working with BAM files for large chromosomes like the ones in the wheat genome requires using the CSI index, as the BAI index is limited to sequences smaller than 512 Mbp. We have enabled support for the CSI index in the main Persephone application as well as in the loader tool PersephoneShell that is used for loading the data to the database.


