Major version upgrade: variants
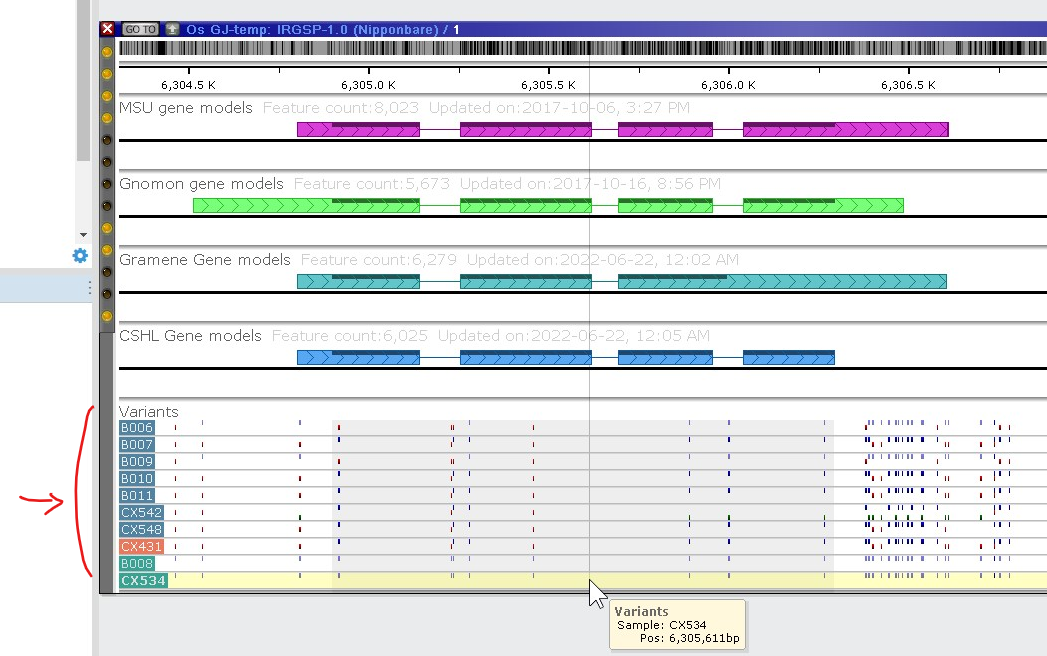
We are happy to introduce a major new feature in the web version: a specialized interface designed to analyze genotyping samples with SNPs and indels. The variant data for thousands of individuals are displayed as a new type of track alongside other tracks, such as gene models, markers or NGS read alignments.
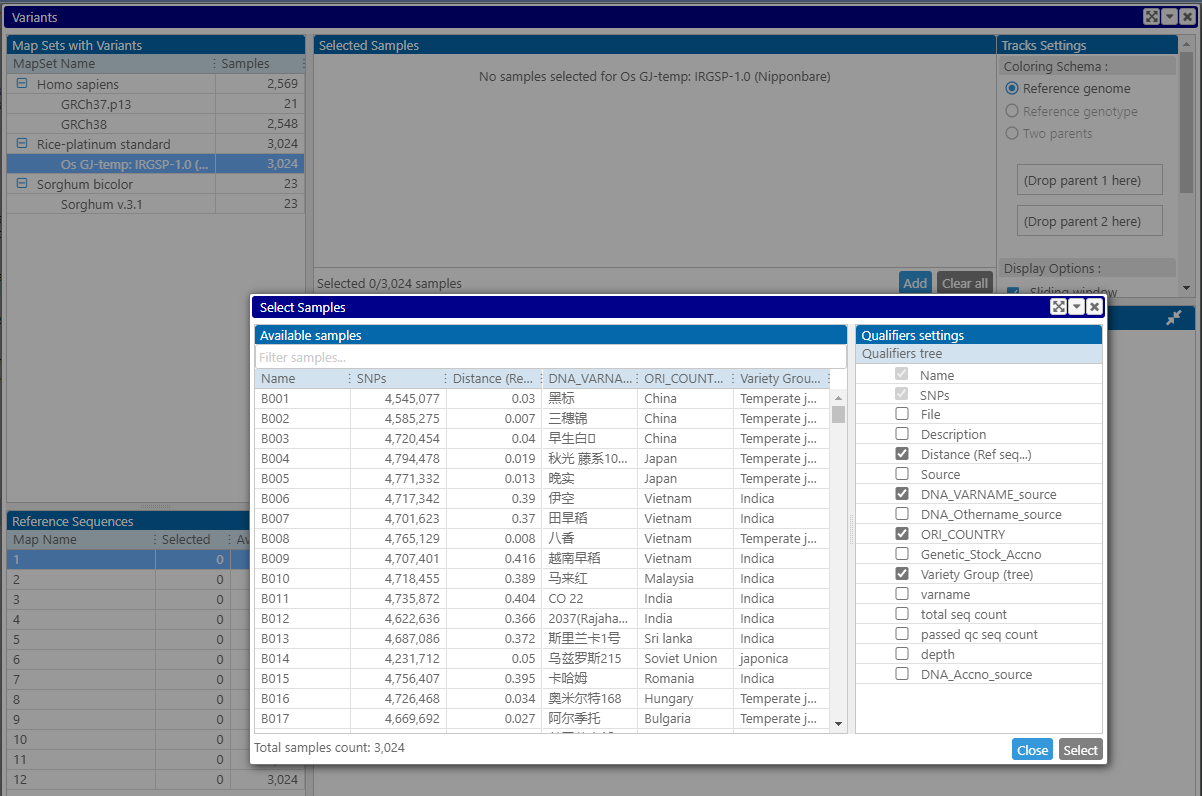
The new feature is powerful enough to deal with thousands of individual samples. For example, we have loaded resequencing data for 3,024 rice varieties (4 million SNPs each) to our web portal. Our proprietary database contains 2500 samples for the human genome, with each of them having 85 million variants. This is 200 billion SNPs and indels 😉
The user first selects the reference genome, in the case of rice – a well-known IRGSP (Nipponbare) assembly, and opens the interface to browse through available varieties. Each sample can have additional information, such as the country of origin or phenotypic measurements, which helps to narrow down the selection of genotypes. The list of columns in the grid is controlled by the checkboxes on the right.
This metadata can be handy not only with the selection of samples. It can also be used to assign individual colors to the samples based on the distinct values in the corresponding column. For example, if the selected data set contains varieties from Japan and Vietnam, each country can be represented by a distinct color:
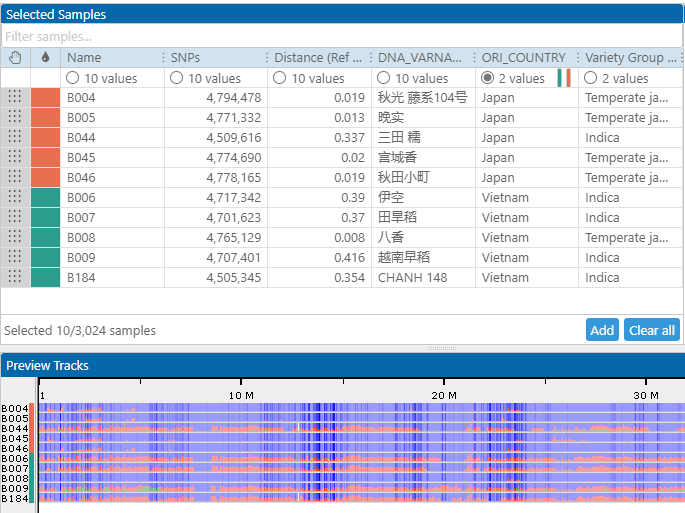
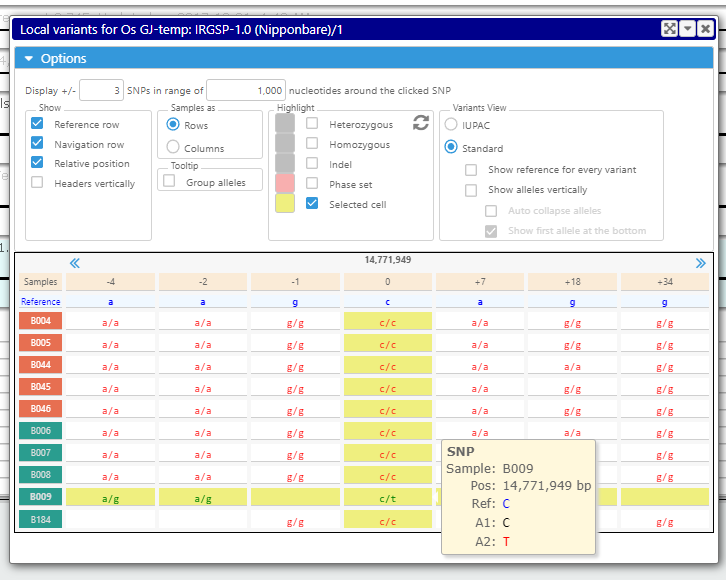
The panel at the bottom of the form shows the compact view of the mutations along the chromosome sequence. Each SNP/indel can be painted using three colors: blue (the same as reference), red (different from reference), and green (heterozygous call). The view is zoomable. The samples can be sorted based on the values in the grid columns. One of the columns shows the genetic distance between the sample and the reference. If sorted by the distance, the bottom view will show the samples that are close relatives to the reference at the top of the list.
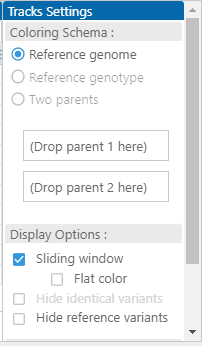
In addition to the main coloring schema based on the comparison of alleles to the reference genomic sequence, we have two more modes. One of them allows calculating the colors based on a selected sample, nominated as a new reference. All alleles that are identical to the reference genotype will be painted blue, etc. It is also possible to nominate two parents. In that case, the alleles that are the same as parent 1 are blue, and the bases from parent 2 will be painted red. If the nucleotides at a site in parent 1 and parent 2 are the same, they are shown in gray. Using these color schemas allows for visualizing haplotype blocks, which becomes quite informative in combination with the genetic distance metrics.
The new track with variants can be added to the list of other tracks for a map. Once zoomed deep enough, the view shows individual bases. It is possible to analyze the neighborhood of a selected variant by clicking the corresponding letter or symbol in the variation track.
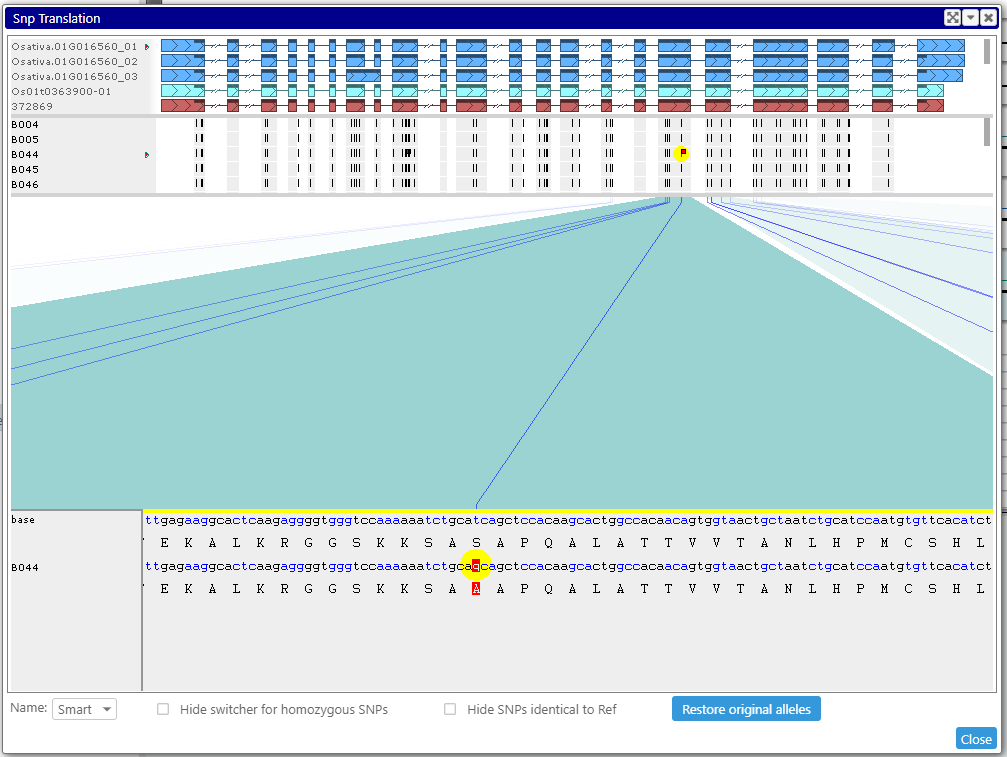
If you want to see if the mutation that falls into a CDS region affects translation, call a specialized interface where you will see the variants that change the amino acids. In case of the heterozygous calls, you can select one of the alleles and see its effect on the resulting protein sequence. If the SNPs are phased, all linked alleles will change accordingly.
Note that all Persephone tools for studying variants work also with tetraploid organisms, such as the potato genome.