Feature Update: New Functionality For BAM Tracks
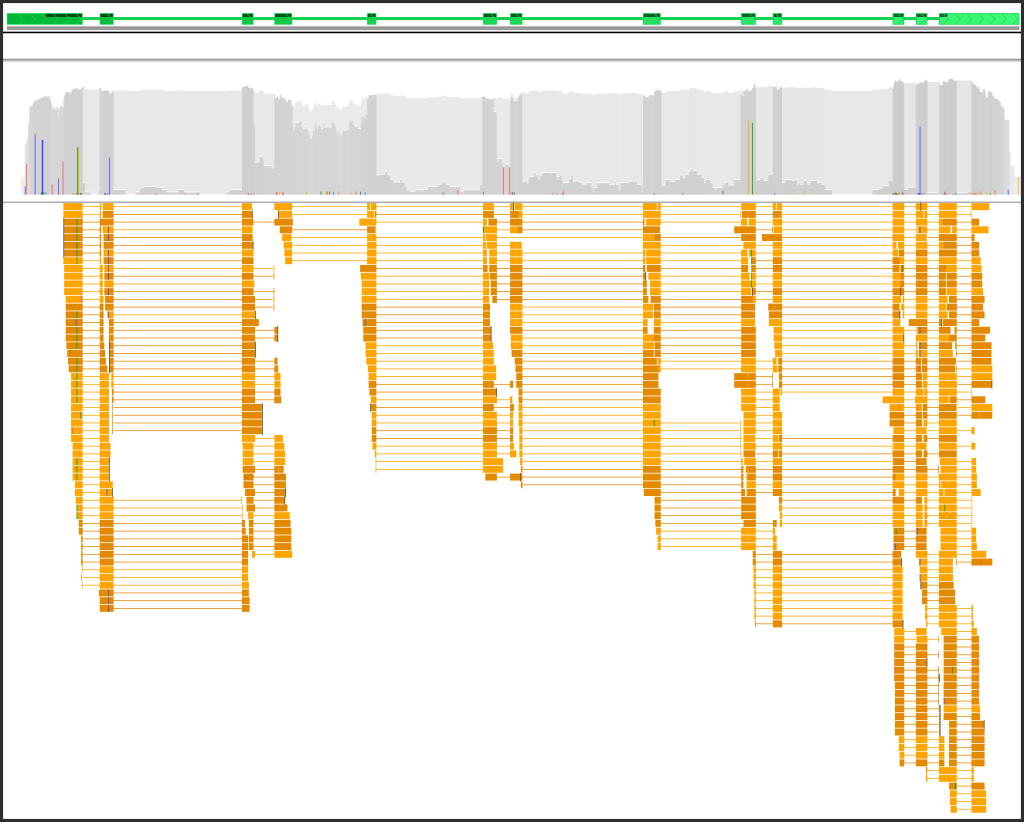
- We significantly increased the limits on the amount of data displayed in BAM/CRAM tracks. There can be genomic regions with a large number of mapped reads. Persephone can now handle peaks of up to 300,000 reads. Naturally, they all will not fit the screen, but the statistics for each site will be calculated based on the analysis of all available reads.
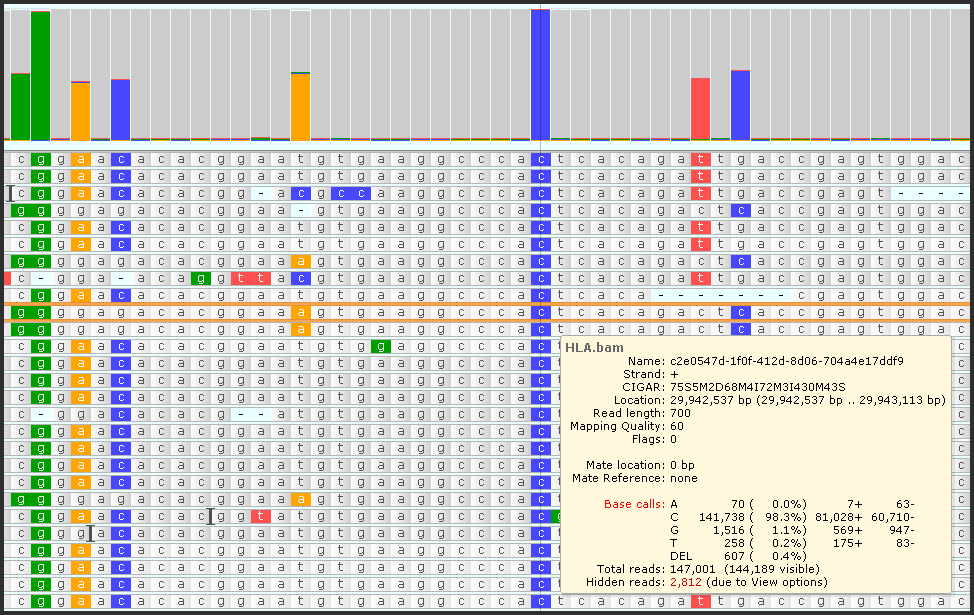
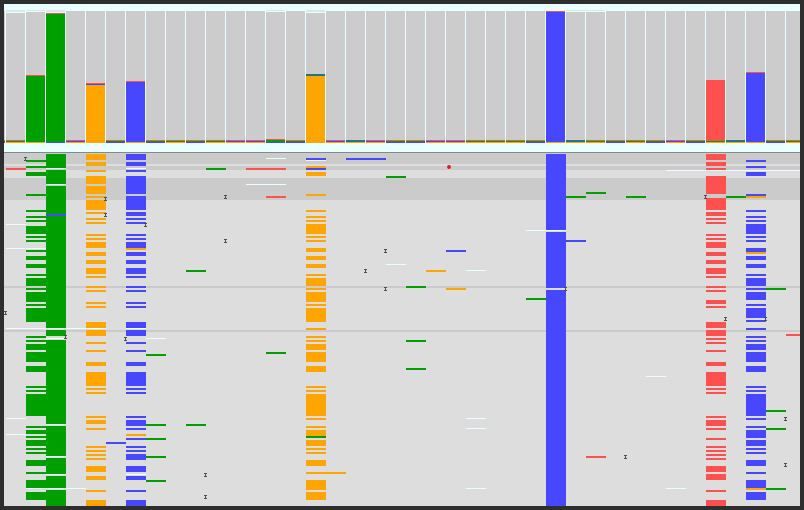
- Downsampling. Even if you have peaks with millions of reads falling on the same area, we can remove the redundancy of the reads by grouping identical sequences. This will help visualize the mappings of the reads that would otherwise be off-screen. The statistics will not be affected by grouping.
- To fit more reads on the screen, you can reduce their size to a minimum of 2 pixels high.
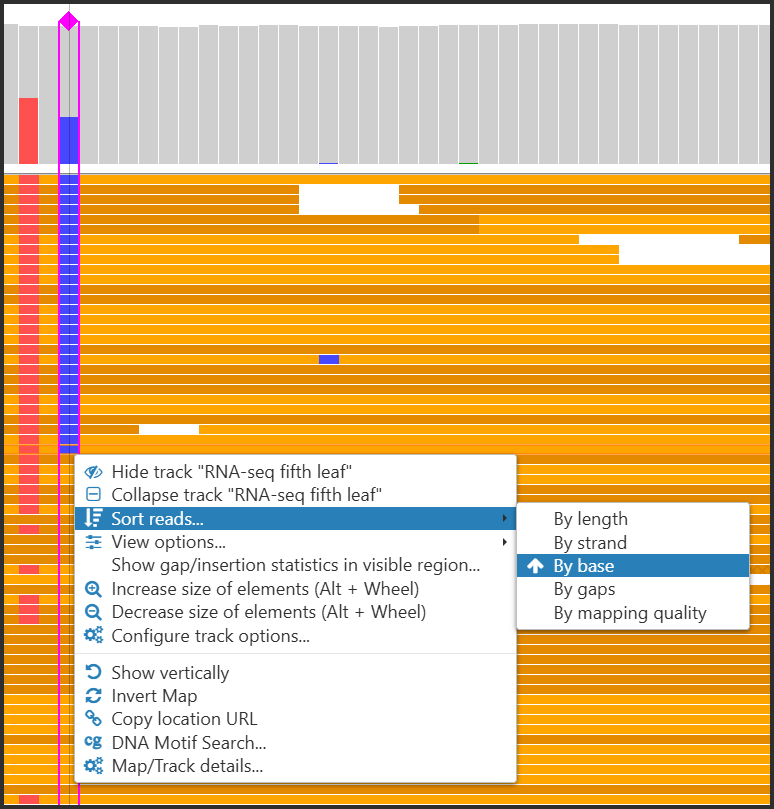
- The reads can be sorted at a specific position by various properties, such as base call, read length, strand, etc.
- Now you can hide the reads that do not span introns leaving only those that can serve as an evidence in splice site prediction.
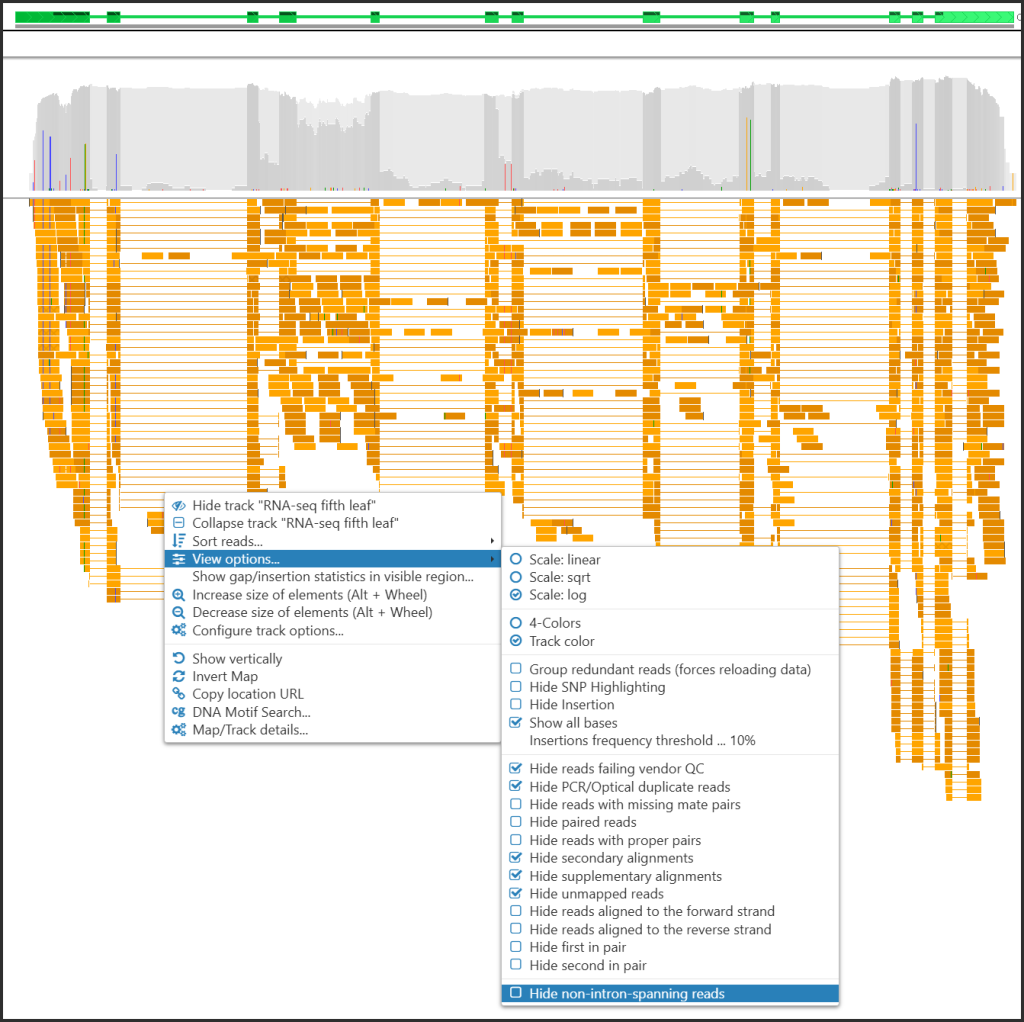
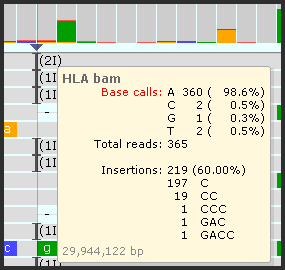
- An insertion mark will be shown in the coverage plots only if the relative frequency of the insertions is higher than a specified threshold (10% by default):
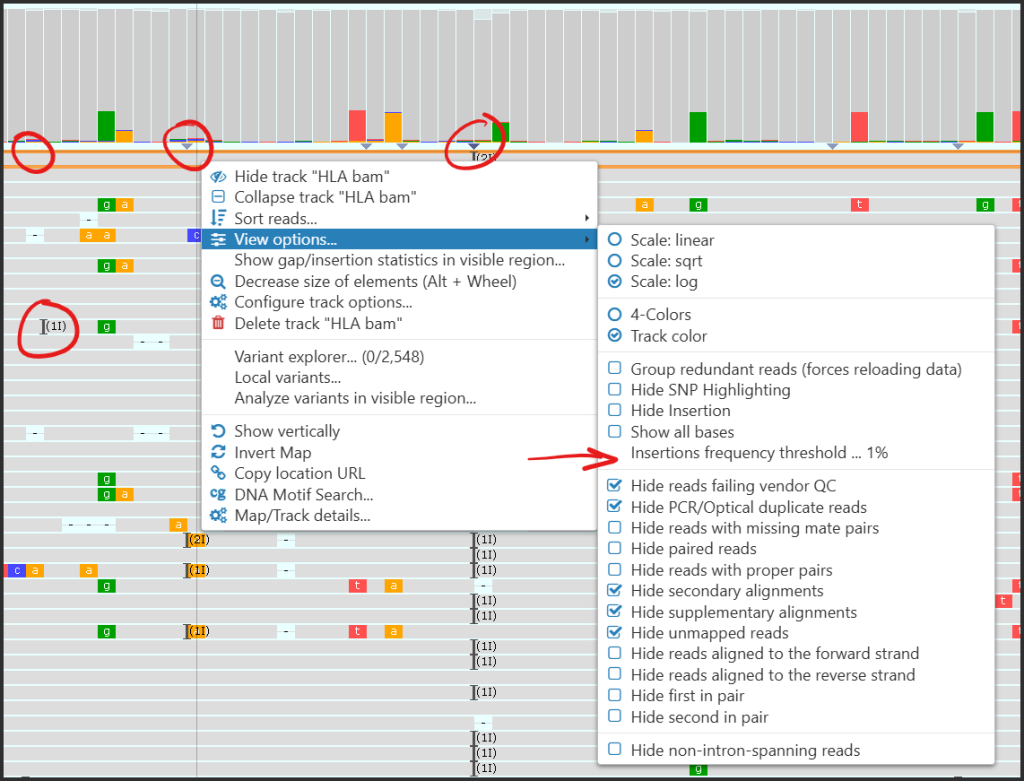
Hover over the insertion mark to see the summary of possible insertions detected at the given position.
- The speed of rendering of the BAM tracks has been greately improved. This will be especially noticeable with the processing-intensive long reads with methylation signals.
- We also changed the way we show the BAM/CRAM tracks at low zoom. When the entire map is shown, the track is automatically displayed in its collapsed state, which does not occupy too much space on the screen. Once the zoom level increases to the point when we can display individual reads, the track will automatically expand.