Another major feature upgrade: Export track data
We have made a significant step forward by adding a few new features. One of them is a powerful module for exporting data from the Persephone database. This can be done in an interactive way by using a graphical user interface. The track data can be exported from a selected region of a specific map or from the entire map set. The rows can be sorted and filtered using complex criteria. For example, by applying filters to the gene function and selecting FASTA file for output, it is possible to export promoter sequences for genes that have specific word in their description.
The export engine has been written to handle large data sets. For example, it is powerful enough to export 85 million human SNPs presented as a marker track with named positions. Besides exporting the features, this interface allows running a quick analysis, such as collecting statistics on the exon counts or CDS length, or checking if the protein sequences start with ‘M’, etc.
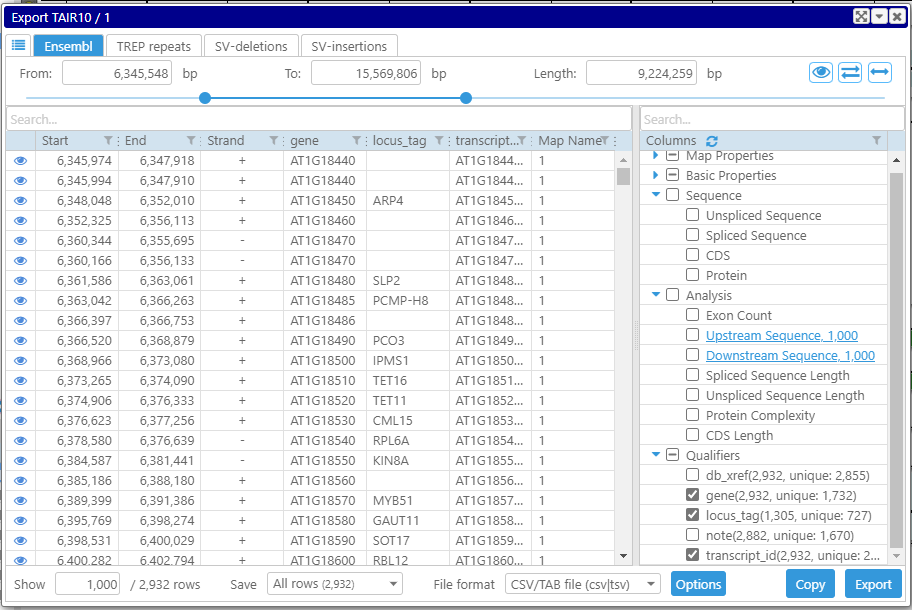
The list of columns in the data grid is controlled by the checkboxes in the right panel. They are separated into categories. For gene models, you can export the sequences associated with the genes: the spliced and unspliced sequences, CDS, or protein sequences. Note that when exporting a single track (as opposed to the entire map set), the numbers of qualifier records are displayed together with the counts of distinct values. This might be quite useful, for example, when analyzing which qualifier to use as a unique identifier of a gene model.
The grid will automatically shrink if the set of selected columns results in identical rows. For example, if you narrow down the list of columns to just Strand, expect to see at most two rows: for direct (+) and opposite (-) orientations.
The panel on the bottom of the form lists the number of displayed and total rows. If you want to analyze all the features without exporting, increase the number of displayed rows to the maximum (it will be adjusted not to exceed the total count of rows). This will load all the rows for analysis into the data grid. The columns can be filtered based on different criteria:
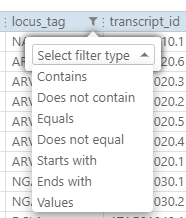
For example, if you want to check if the gene models produce protein sequences that all start with ‘M’, select ‘Protein’ column and sort it, so that all the problematic sequences appear at the top or the bottom of the list. You can also apply sorting to the CDS length column and see abnormally short translated sequences.
With tab- or comma-delimited files, the output will contain all columns from the grid. You can decide which rows to export: all available rows, only selected ones, or the rows in the preview. When one of the columns contains a sequence, the output can be saved as FASTA file. Open Options and select the format of the FASTA header:
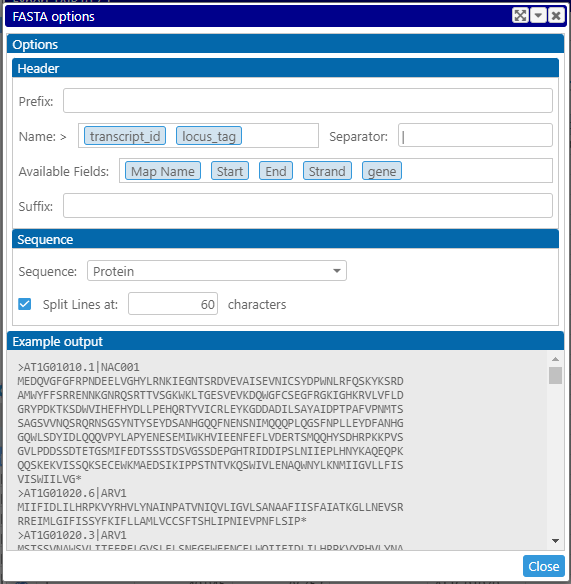
Drag the labels into the Name: field to form the FASTA header. Please see the preview in the Example output.
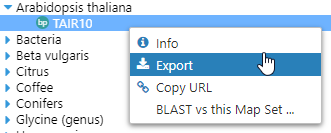
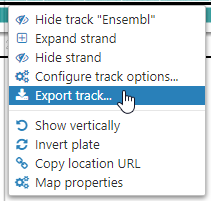
Access the Export GUI via the context menu for a track.
or for the map set in the map set tree: