



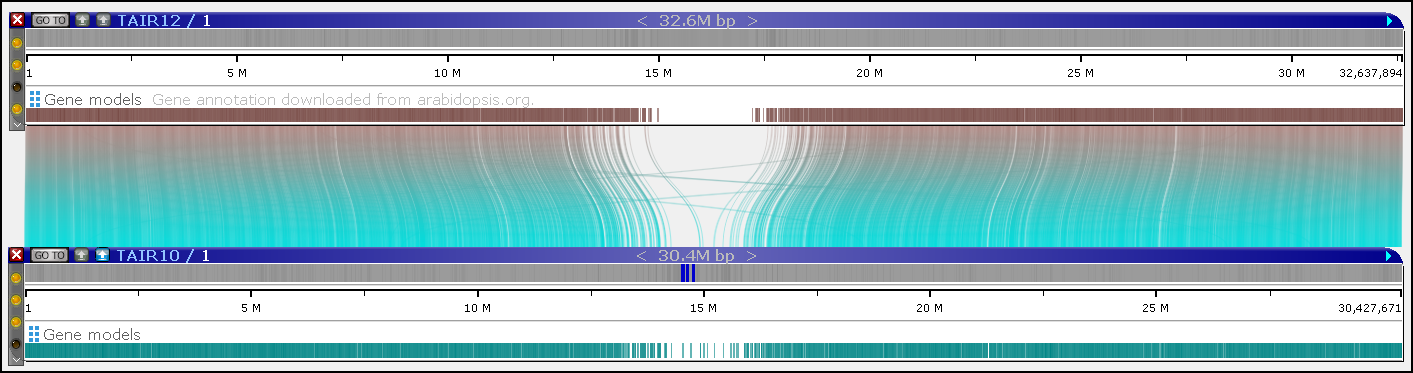
TAIR12 vs TAIR10. A Quick Visual Inspection
The new version of the Arabidopsis thaliana genome, TAIR12, is now in Persephone.
The corresponding Genetics paper on TAIR12 describes “the community-driven reannotation of the A. thaliana Col-0 reference genome, which integrates new long-read assemblies, updated structural annotations, and expert manual review and involved contributions by over 100 scientists worldwide.” “The Schneeberger laboratory at the Max Planck Institute in Cologne assembled the new chromosome backbone, the foundation of the reannotation, from 13 high-quality long-read genome sequences of the reference ecotype Col-0 (TAIR12 paper, in preparation)”.
Using Persephone, we quickly compared the TAIR10 and TAIR12 versions and produced a few images that users can generate in real time.
Our dataset includes the new assemblies, the gene model track from TAIR, and the alignment of public Arabidopsis ESTs generated with hisat2.
To see the sequence differences on a large scale, we ran the instant minimap2 alignment – just pushed that small blue square button:
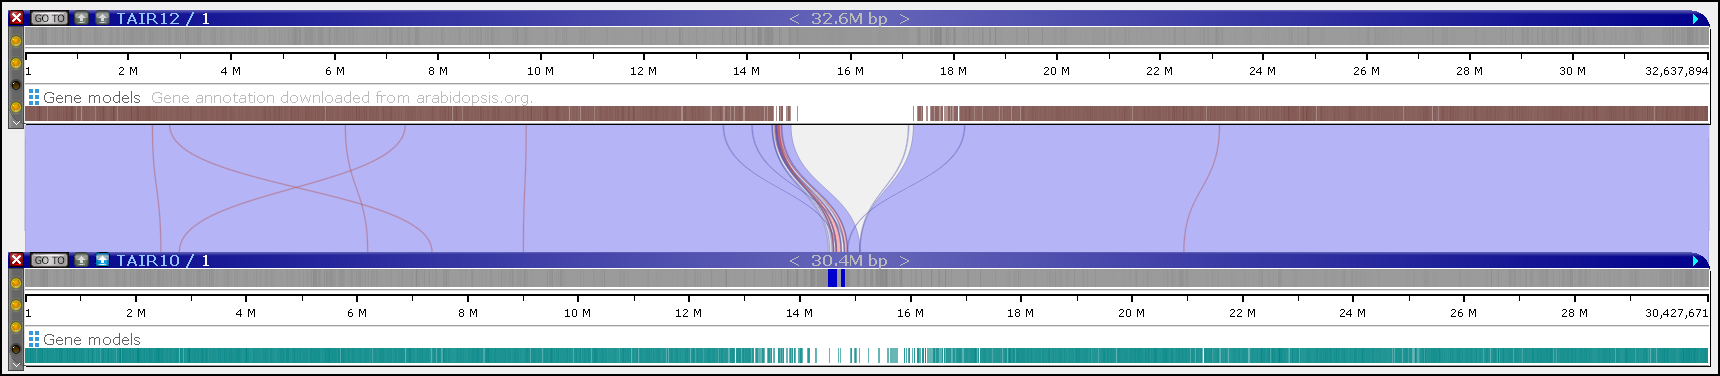
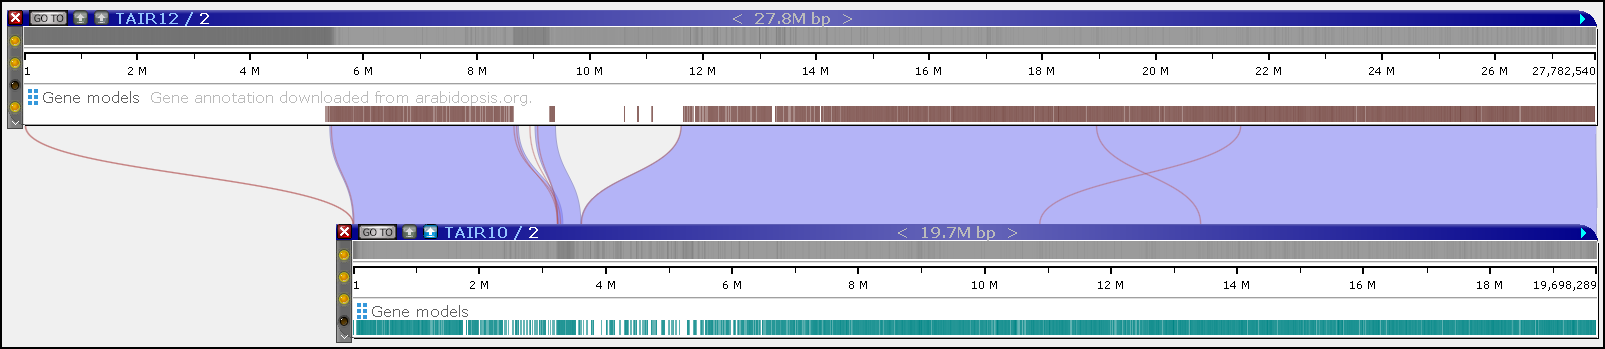
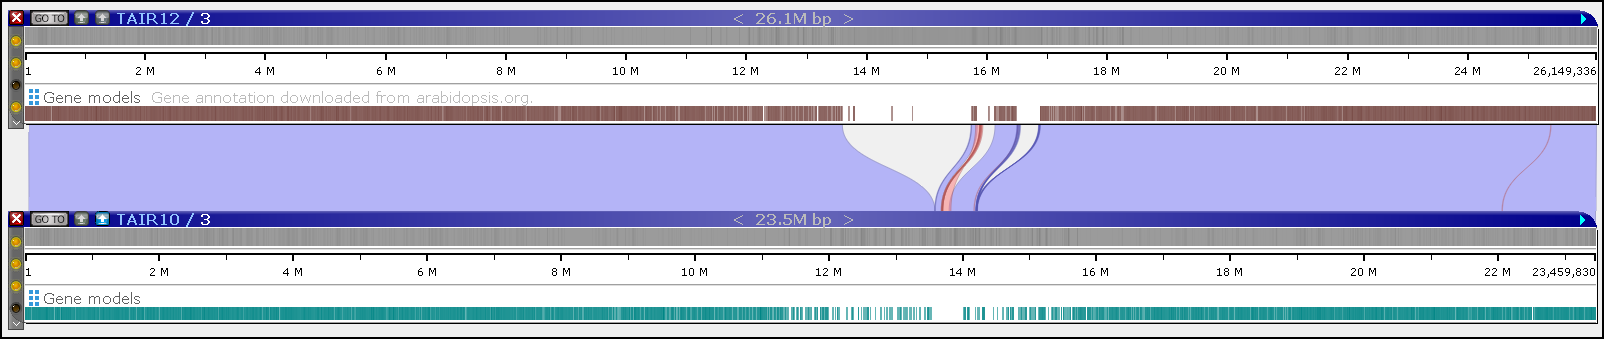
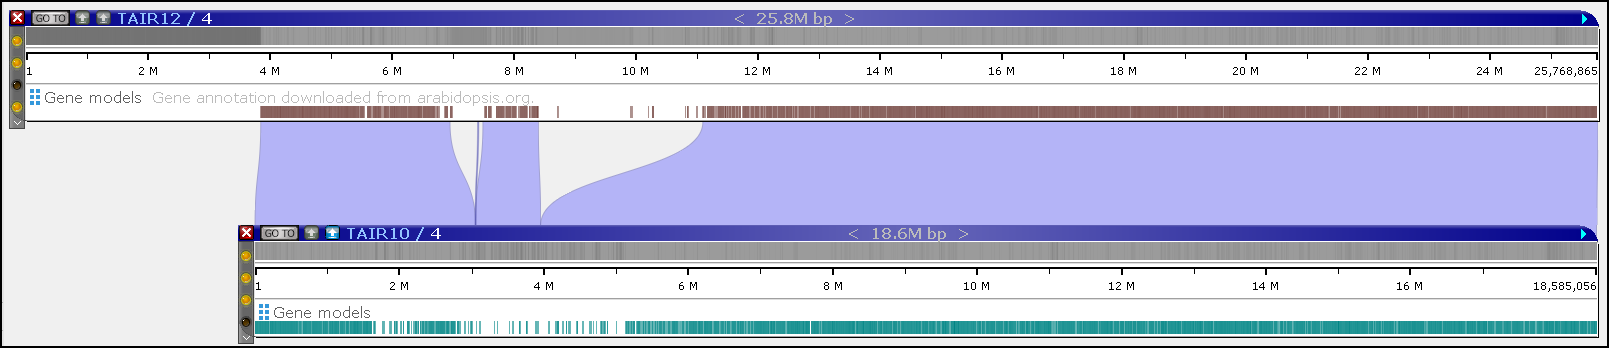
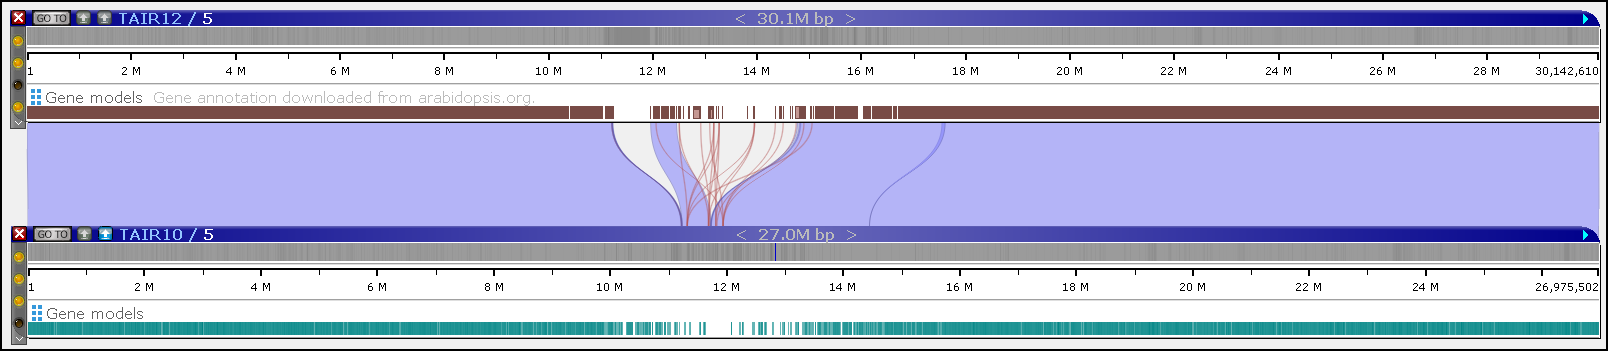
We can observe significant sequence changes, especially around centromeres and telomeres. The red ribbons indicate inversions.
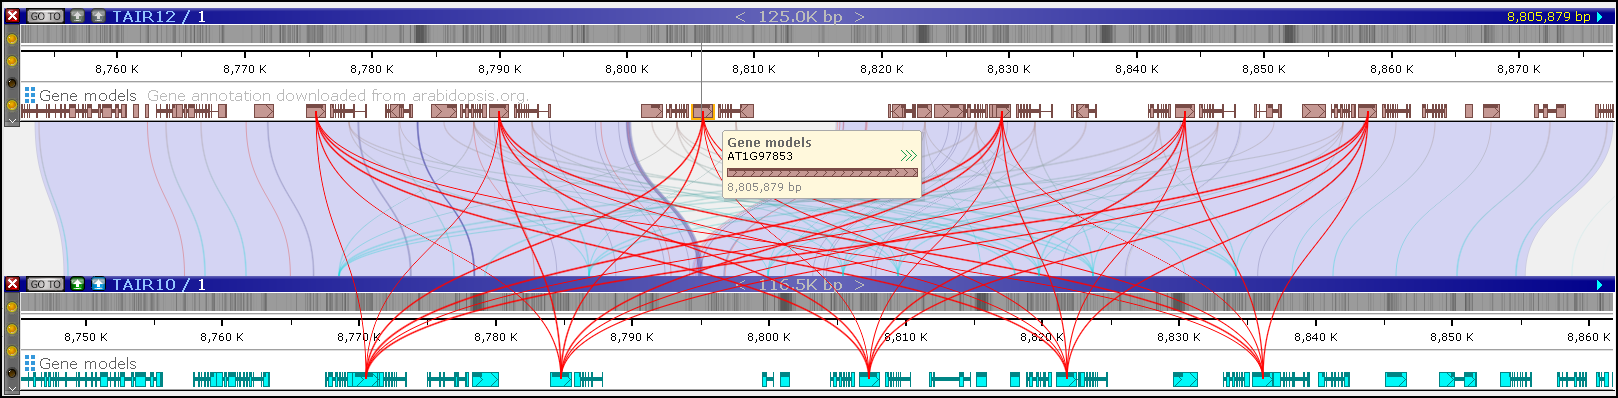
We can show thin lines between corresponding loci (strictly speaking, we cannot call them orthologs).
On zooming further, we can see the gene rearrangement. For example, here we find extra copies of some repeated genes. The blue ribbons connect identical sequences detected by BLASTN:
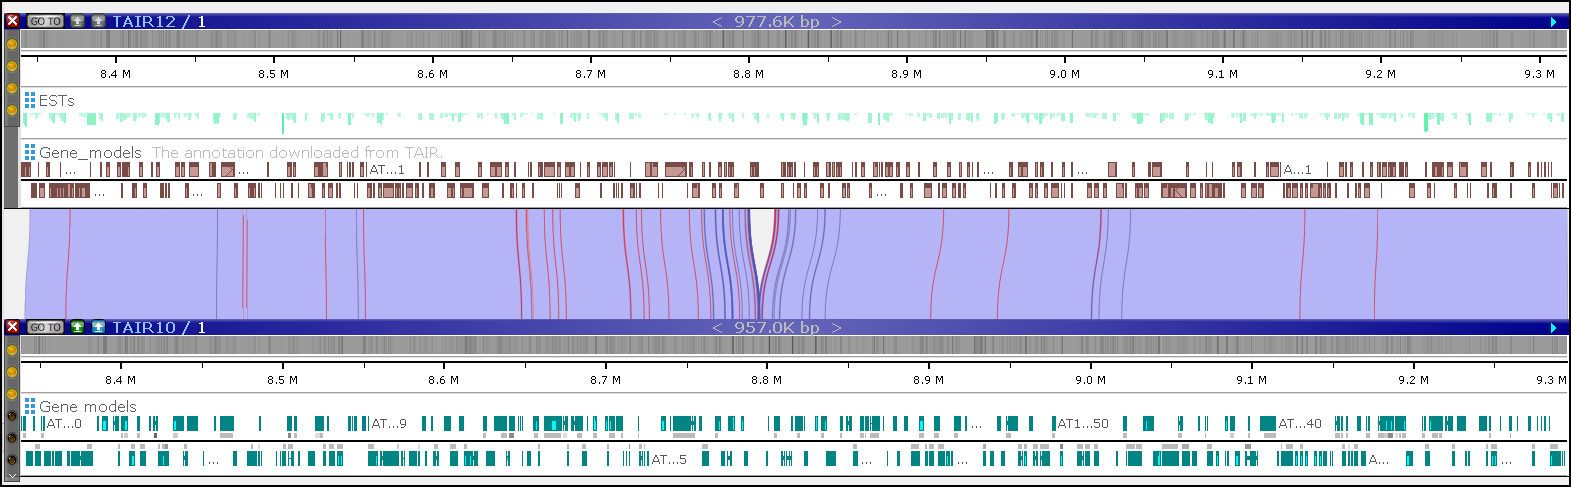
The BLASTN sequence comparison (that small green button on the left) reveals single-base mismatches and indels. This illustration shows how frequent they are.
When working with data files, we were surprised to find that the GenBank GFF file containing gene annotations had an unusual structure. Each gene model appeared twice: once as an ‘mRNA’ record, including exons and CDS, and again as a set of exons associated with a ‘gene’ record, without any CDS. We hope TAIR can help GenBank consolidate the GFF file, which likely contains redundant records generated when merging multiple annotation sources.
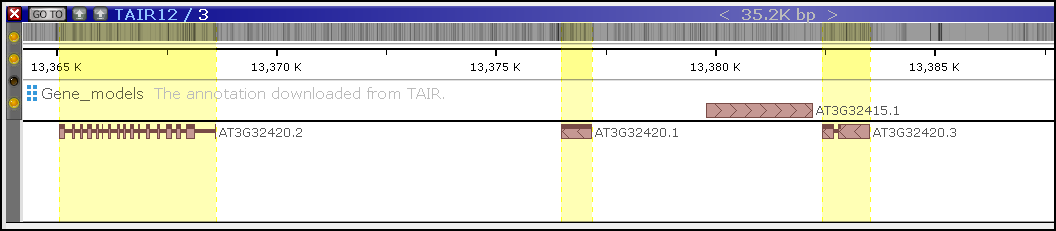
As for the gene models themselves, our loading tool PersephoneShell detected a couple of minor inconsistencies. For example, some transcripts that share the same gene name (e.g, AT3G32420) predict CDS in non-overlapping segments of the genome:
This post is about our first impressions from visual observations. Side‑by‑side views in Persephone highlight not only large‑scale improvements—such as corrected inversions and extended chromosome ends—but also fine‑scale differences revealed by BLASTN, including frequent substitutions and indels. Although most loci map cleanly between versions, the rearrangements, duplicated genes, and annotation inconsistencies we observed underscore why a modern, long‑read–based reference is essential.
You can see a more systematic version comparison in the paper cited above.
Please let us know if you would like to see more analysis.