A new feature in the desktop version: Export connector clusters as ribbons
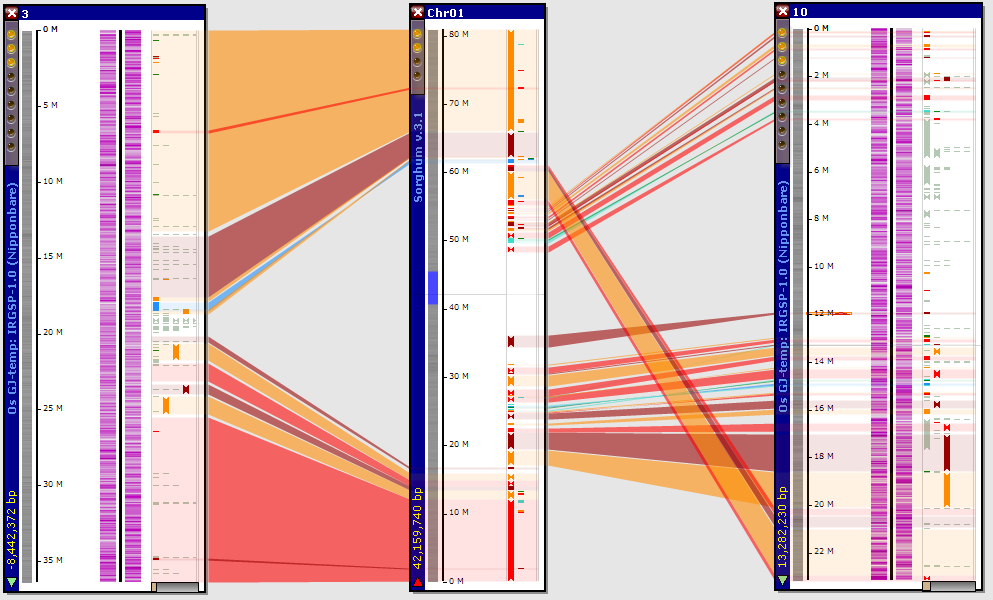
The synteny matrix in the desktop version of Persephone that visualizes the alignment of entire genomes has a useful feature – clustering the connectors in the dot plot. Collinear connectors between orthologs or markers appear as a series of dots that tend to form a line in the synteny matrix. Such groups of dots mark areas of synteny. In a simplified view, the individual connector lines could be “bundled” to ribbon-like elements that show large-scale rearrangements. In the new version, the result of clustering such groups of dots can be exported as a file with cluster coordinates (the button “Export clusters…”). If needed, the positions of these clusters can be later loaded into the database (using PersephoneShell) to be represented as ribbons linking the syntenic regions of maps.
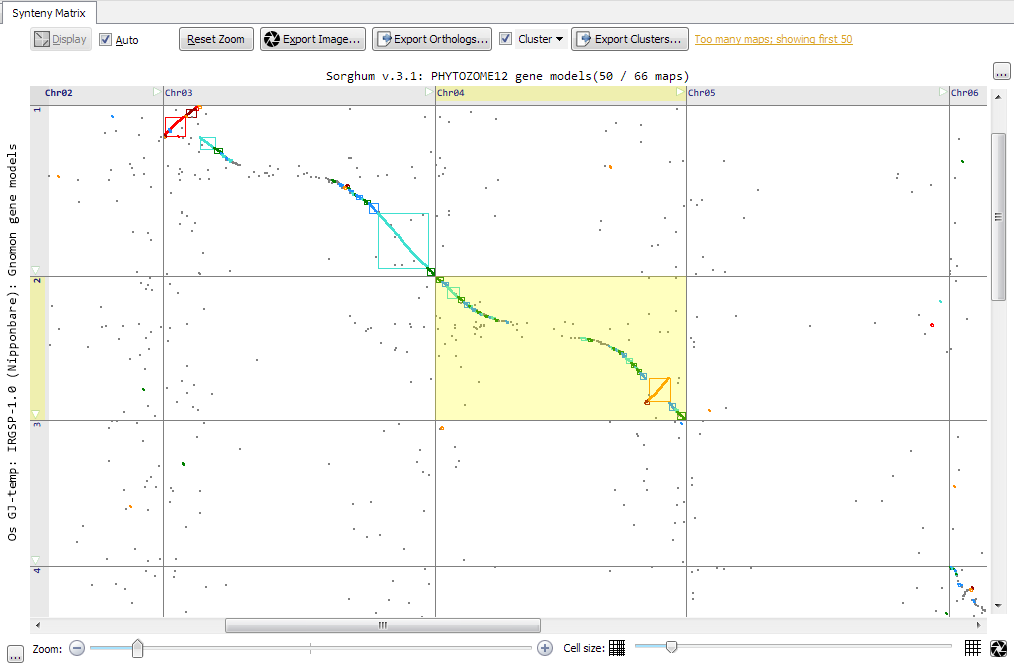
In the future, we plan to allow users to visualize the clusters as ribbons without the need for intermediate files.